

Using three timeframes with RSI for contrarian trading
Hello today!
The FX Research, this is Satoli.
This time, I examined an indicator that uses RSI across three time frames to generate reversal signals.
The one used for the verification is,the Early Entry MT4 RSIMA 3-Time-Frame Counter-Trend Signal Indicator.
The Early Entry MT4 RSIMA 3-Time-Frame Counter-Trend Signal Indicator displays a reversal buy signal when, among three consecutive time frames RSI, the top two are above 50 and the current RSI dips below 40; and displays a reversal sell signal when the top two are below 50 and the current RSI rises above 60.
The figure below is the USDJPY 1-hour chart.
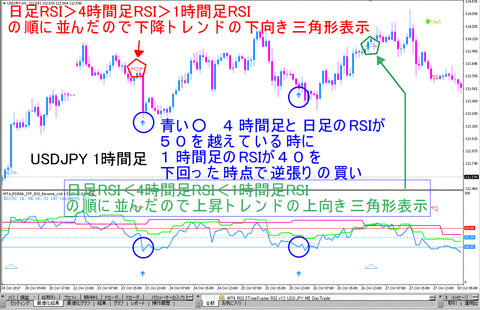
In the above, when 1-hour RSI > 4-hour RSI > daily RSI is satisfied, a blue upward triangle is displayed,and when 1-hour RSI < 4-hour RSI < daily RSI is satisfied, a red downward triangle is displayed.
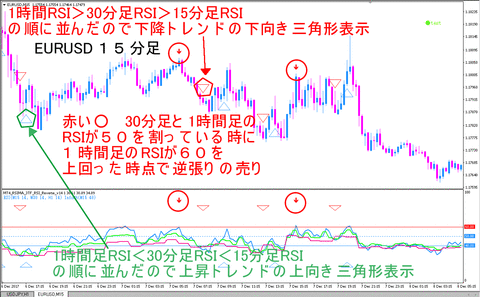
The figure below is the EURUSD 15-minute chart.
The figure below is the AUDJPY 4-hour chart.
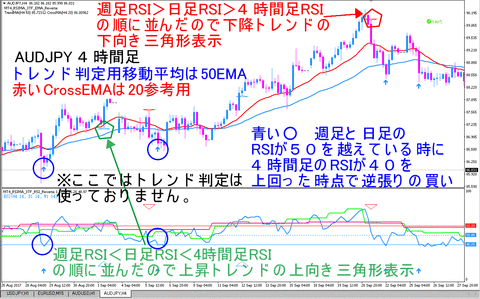
Among the EMAs above, the slope of the blue trend-detection EMA controls the indicator signals.
By default, EMA is not used, so please view the included EMA indicator for reference.
Technical Trade Blog Ranking
※ Please register for the free newsletter "FX Research" at the URL below.
http://abproducts.biz/melmaga/


