

The Dow Theory was still alive on the weekly chart of the new上市 Mexico Peso yen!
Hello!
This is Satori with FX research.
Now, this time I performed a technical analysis on the Mexican Peso/Yen pair that has just been newly listed on the exchange FX “Click 365.”
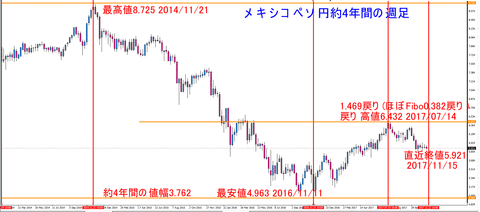
The figure above is a four-year weekly chart of the MXN/JPY.
From a high of 8.725 three years ago, it declined for two years, and about one year ago it reached a low of 4.963.
In July this year, it retraced 0.382 of the Fibonacci retracement from a decline distance of 3.762, reaching a high of 6.432, and four months later, as of November 15, 2017, it fell to the 5.921 level.
“Fibonacci Retracement Indicator Push Up” I analyzed it.
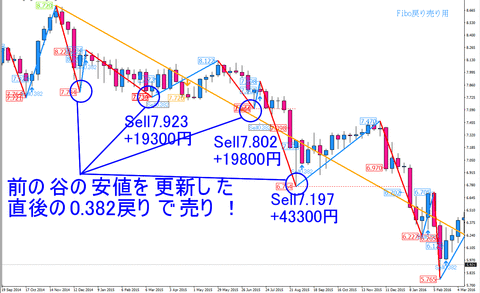
The above figure shows the first half of a two-year downtrend.
It is observed that the retracement high did not surpass the previous peak and the troughs are also lower.
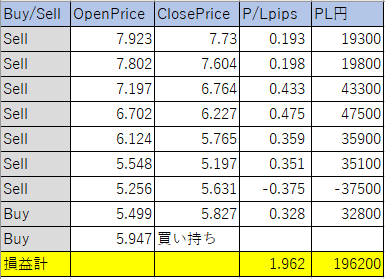
If after the retracement high you sell at the 0.382 retracement and close at the low of the immediate preceding trough, with a trade size of 100,000 units, profits would be +19,300 yen, +19,800 yen, and +43,300 yen, a three-win streak.
As a side note, the margin is assumed to start at 32,000 yen, which is 1/25 of the contracted amount of about 800,000 yen from four years ago.
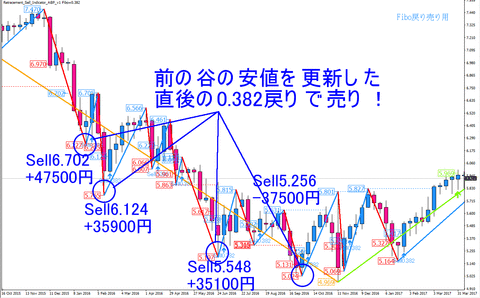
The above figure shows the latter half of the two-year downtrend.
It is observed that the retracement high did not surpass the previous peak and the troughs are also lower.
If after the retracement high you sell at the 0.382 retracement and close at the low of the immediate preceding trough, with a trade size of 100,000 units, profits would be +47,500 yen, +35,900 yen, and +35,100 yen, a three-win streak, totaling six wins from the early downtrend.
Although there was a loss of -37,500 yen when the trend shifted from a downtrend to an uptrend, the cumulative total up to this point is still a net profit.
Finally, as shown in the figure below, it turned into an uptrend, yielding a buy profit of +32,800 yen.
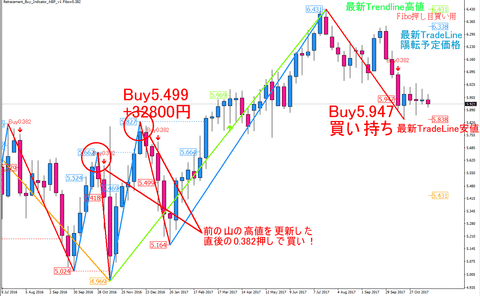
In the most recent year, the drawdown bottom did not break the previous trough and the highs rose, indicating a shift to an uptrend.
If you buy after the pullback from the pullback low at the 0.382 level and close at the recent peak, with a trade size of 100,000 units, you would have earned +32,800 yen, resulting in a total of 7 wins and 1 loss for +196,200 yen overall.
100,000 units (margin started at 32,000 yen)
The above figure shows the past four years of weekly Fibonacci retracement 0.382 pullback and retracement results for MXN/JPY, currently held as a long position.
Because Mexico’s policy rate is around 7%, there is ample appeal for swap income as well, but based on weekly technical analysis using Fibonacci retracement, with an initial margin of 32,000 yen, the profit was 196,200 yen, totaling 228,200 yen, more than seven times the initial margin.
Indeed, the Dow Theory was applicable to MXN/JPY as well.
The indicators used in this analysis are as follows.
Fibonacci Retracement Indicator Push Up
Additionally, in compiling this article, I attended a seminar at the Tokyo Financial Exchange on November 17, 2017, and received materials and data from related parties about the current state and outlook of the Mexican economy, which I will present here.
〇 Features of Exchange FX “Click 365”
・Capital adequacy
・No order rejection or slippage
・Swaps are larger than over-the-counter FX
・MM system with strong market makers providing quotes, offering peace of mind
The weekly MXN/JPY data for this analysis was provided by the Click 365 intermediary Fuji Tomi and imported into MT4.
GogoJiang, well known from fx-on, sponsored the seminar operations and the social gathering.
Please stay healthy and well.
Technical Trade Blog Ranking


