

AUDJPY 5-minute chart: Subtle relationship between MACD and Fibonacci
Hello!
Satori here, researching FX.
This time, we introduce the subtle relationship between MACD and Fibonacci on the AUDJPY 5-minute chart.
The figure below is the AUDJPY 5-minute chart from November 24.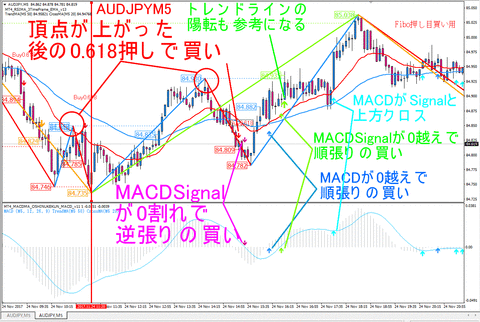
In the upper figure, after forming a higher peak than the previous peak and it reverses at 0.618, the pullback buying signal appeared, but the MACDSignal was also near zero and a downward arrow appeared.
The above timing is a pullback buying point.
After that, MACD and MACDSignal crossed above zero and an upward arrow appeared.
Since it did not break the previous valley's low and turned upward, a trend-following buy was correct.
Furthermore, the trend line has turned positive afterward.
In this way, before the trend turns positive, it is also effective to compare Fibonacci retracement with MACD to time a buy.
The indicators used this time are the following two.
Pullback-buy indicator MACDMA Breakthrough
Fibonacci Retracement Indicator Push Up
Please take care and stay well.
Technical Trading Blog Ranking


