

I examined the fluctuations of the Nikkei 225.
Good day.
FX research, this is Satori.
Yesterday, the Nikkei Stock Average briefly surpassed the bubble-era high of 22,666 yen, about 26 years after it first reached that level,
TodayN-shaped Entry Indicatorto draw the high and low lines for the Nikkei 225 CFD.
Of course, the lines are drawn automatically.
CFD stands for "Contracts For Difference," which in Japanese is “差金決済取引”.
FX is also a part of CFD.
That means you can buy/sell the Nikkei Average in the same way as FX.
The figure below shows the recent two months of movement for the Nikkei Average.
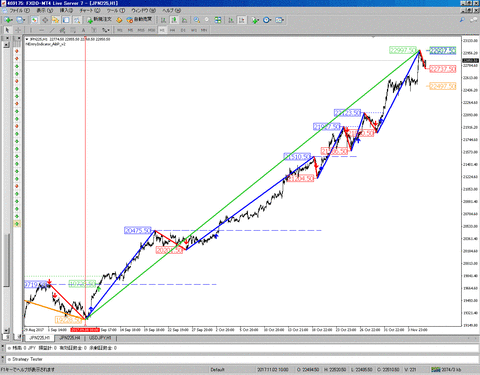
The green and orange trend lines indicate a 500-yen reversal, and the blue and red trade lines indicate a 250-yen reversal.
Over two months, there was roughly a 3,800-yen uptrend, so whether contrarian or trend-following, if you traded in the direction of the trend there were plenty of profit-taking opportunities.
The vertical red line marks the low for the past two months, on September 8, 2017.
From there, Elliott Wave formed, and we are currently updating the 5th wave.
A pullback is expected for a while, but it is holding up firmly.
Next, the figure below shows the movement of roughly the last year and a half, including a box-range since February 2016.
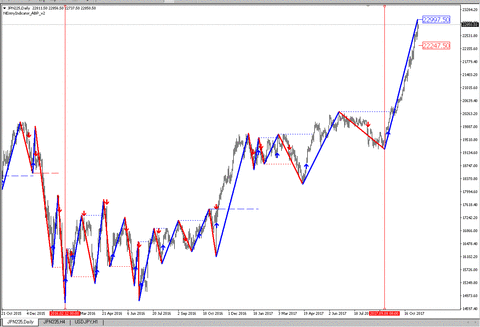
Even while consolidating, the lows were rising, accumulating upward energy.
On September 8, it exhausted the downward energy and turned sharply higher.
If you buy on a high break, it seems probability is higher when you confirm that the lows are rising before the breakout.
This will be implemented in a free upgrade of the N-shaped Entry Indicator in the near future.
Thank you very much for reading up to here today.
Please stay well.
Please stay well.
Technical Trade Blog Ranking
///////////////////////////////////
Email: info(at)abproducts.biz
Skype: sinsatori
Blog: N-shaped Entry Action FX Research:
Indicators & Tools & EA:
Publisher: Art Brain Products
Person in charge: Satori Kokoro
× ![]()


