

In a rising wave of 2 yen and 80 sen, a three-win signal case
Good day.
This is Satori, researching FX.
Today, using the N-shaped entry indicator, we introduce a case where trading on a 4-hour chart with an upward trend when a 100-pip reversal occurs, and on a 1-hour chart with an upward reversal of 50 pips, resulted in three consecutive wins.
The upper part of the figure shows USDJPY on the 1-hour chart, and the lower part shows USDJPY on the 4-hour chart.
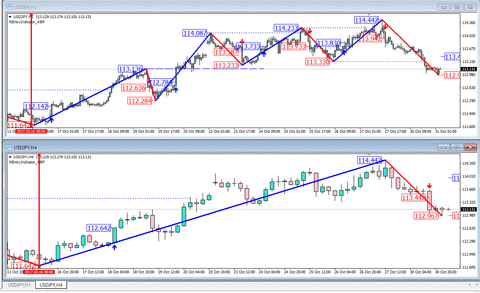
The vertical red line on the left indicates October 16 at 8:00, with the time axis roughly aligned.
In the movement of the last about two weeks, the upward price range was from 111.642 to 114.442, a 2.80-yen swing.
In the movement of the last about two weeks, the upward price range was from 111.642 to 114.442, a 2.80-yen swing.
From the lower 4-hour chart turning bullish to bearish after a downward arrow, the 1-hour chart turned bullish three times with upward arrows.
There were three chances to take profit; for instance, one could buy on the 1-hour chart with an upward arrow, placing the stop loss at the previous valley and take profit at the previous peak.
Within the 1-yen reversal swing, the price formed three counter-movements of 50-pip reversals while making higher lows and higher highs.
This is precisely a reproduction of Dow Theory.
Within the same 1-yen reversal swing, would the 15-minute 20-pip reversal or the 5-minute 10-pip reversal reproduce Dow Theory in the same way? I would like to report on another occasion.
Thus,N-shaped Entry Indicatorpicks out important highs and lows within price movements, providing not only a view of waves but also a guide for entry and exit timing.
Today, I have two announcements.
First, a notice about the price reduction of the GMMA Gap Trading Indicator.
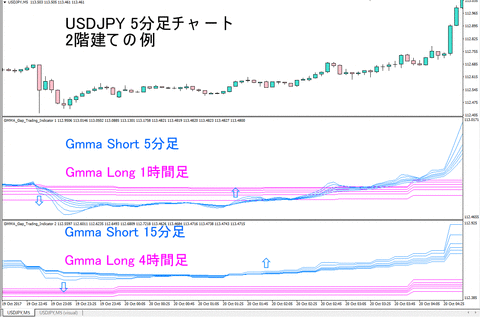
GMMA Gap Trading Indicator displays up to 12 EMAs in a sub-window for a clearer main chart, and you can set Long GMMA and Short GMMA in separate timeframes, offering great flexibility.
When GMMA Long is rising and GMMA Short is falling, you will be notified by downward arrows, email, and alerts, so it can be used as a counter-trend signal.
Similarly, when GMMA Long is rising and GMMA Short shifts from falling to rising, you will be notified by upward arrows, email, and alerts, so it can be used as a trend-following signal.
First, a notice about the price reduction of the GMMA Gap Trading Indicator.
GMMA Gap Trading Indicator displays up to 12 EMAs in a sub-window for a clearer main chart, and you can set Long GMMA and Short GMMA in separate timeframes, offering great flexibility.
When GMMA Long is rising and GMMA Short is falling, you will be notified by downward arrows, email, and alerts, so it can be used as a counter-trend signal.
Similarly, when GMMA Long is rising and GMMA Short shifts from falling to rising, you will be notified by upward arrows, email, and alerts, so it can be used as a trend-following signal.
For those who want to use GMMA but keep the main chart clear, or who want to display GMMA of a higher timeframe on a lower timeframe chart (e.g., showing 1-hour GMMA on a 5-minute chart) to check slope and the gap between Short and Long, or for those who wish to enter early in the trend direction or then join in the trend when it moves upward,GMMA Gap Trading Indicatoris now offered at an affordable price, so please consider it.
Today, we have two announcements, including the Time Select EA with a currency and timeframe free version bundled.
Time Select EA uses RSI and RCI to place up to three positions in counter-trend, but its notable feature is that you can see a daily 24-hour breakdown of which time periods yielded profits, allowing you to trade only in profitable times.
With high win rate and low drawdown, backtests show a PF over 3.0 since 2016, reflecting suitability for recent market conditions.
Even if you prefer discretionary trading, if you want to enter during time periods with high probability of winning—i.e., avoid trading during times with high losing probability—consider Time Select EA as an auto-trading EA or as a time-zone-earnings tester.
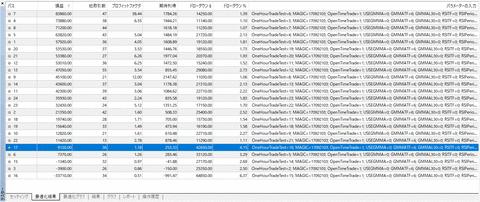
The upper figure shows the time-segmented profitability for USD/JPY.
Time Select EAis also reasonably priced.
Thank you very much for reading up to here today as well.
Please stay healthy and well.
Please stay healthy and well.
Technique Trading Blog Ranking
///////////////////////////////////
Email: info at mark abproducts.biz
Skype: sinsatori
Blog: N-shaped Entry Action FX Research:
Indicators, Tools, & EA:
Publisher: Art Brain Products
担当: Satori Heart
× ![]()


