

Kawasaki Doraemon-ryu Exchange Weather Forecast|Chapter 29 2021 October 18~ Edition
In FX, this series by Kawasaki Dollaremon places emphasis on the temporal element. As the "Forex Weather Forecast," we will share concrete trading strategies based on a statistical approach.
Kawasaki Dollaremon Profile

Kawasaki Doruemon. Frustrated with discretionary trading, he searched for a system trading method that minimizes mental burden and makes profits with ease. After various simulations, he completed Gourgetrain.
Blog:Kawasaki Dollaremon's FX Blog
【Table of Contents】
- Monthly Weather Forecast (31 currency pairs / AUD-related pairs)
- Weekly Weather Forecast (Oct 18–22 / Oct 25–29)
- Daily Weather Forecast (Oct 18/19/20/21/22 / Oct 25/26/27/28/29)
Hello! I'm Kawasaki Dollaremon.
The Forex Weather Forecast is a statistical data set that derives anomalies by analyzing past exchange rate data to see what trends occurred on particular dates.
This time, we will introduce the trends in foreign exchange from October 18 to October 29.
1. Monthly Weather Forecast
First, let us look at the October monthly trend and anomalies.
The table below counts the monthly bars for all 31 currency pairs from 2001 onward.
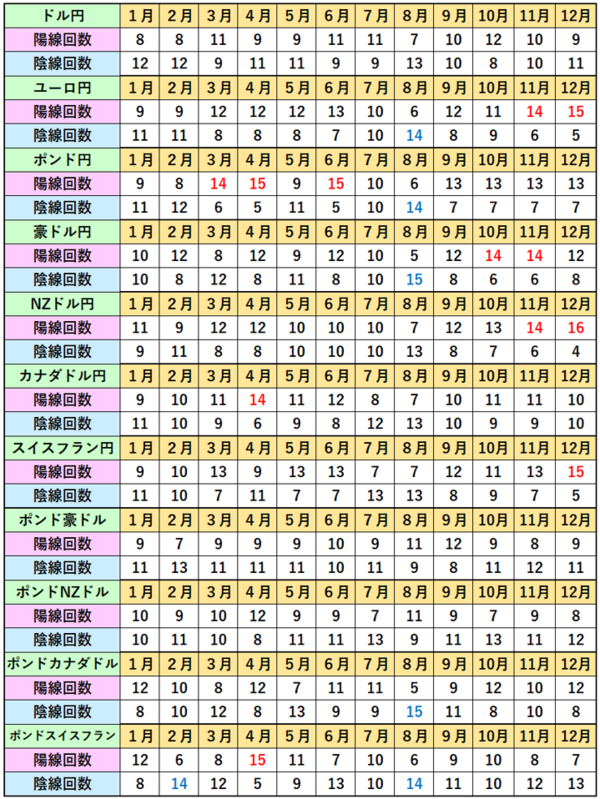
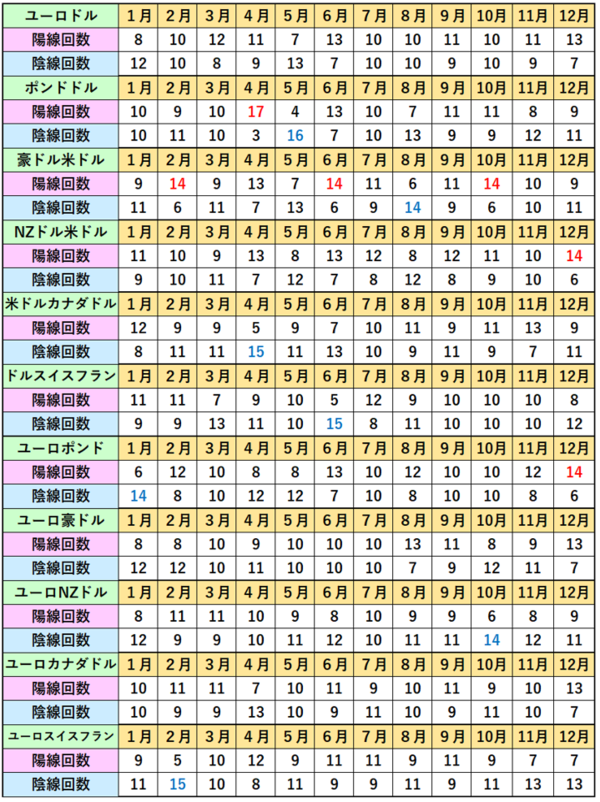
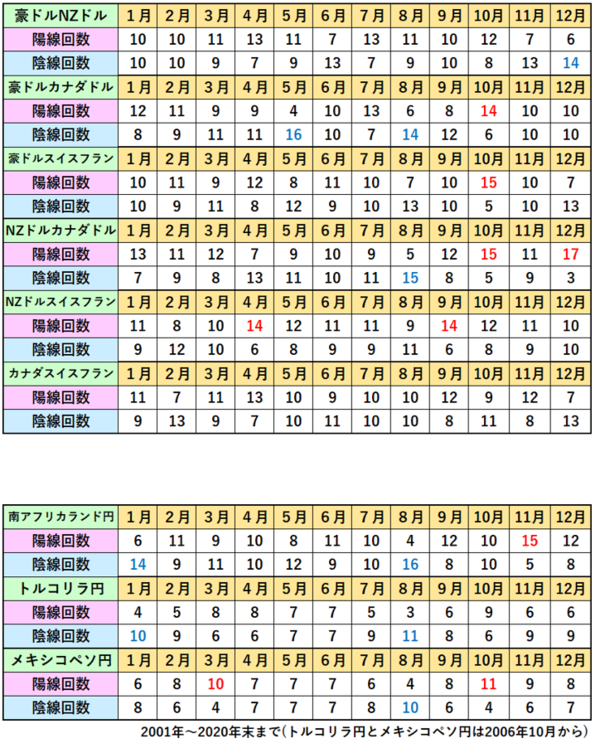
This is hard to read, so let’s extract only the AUD-related currency pairs as in the table below.
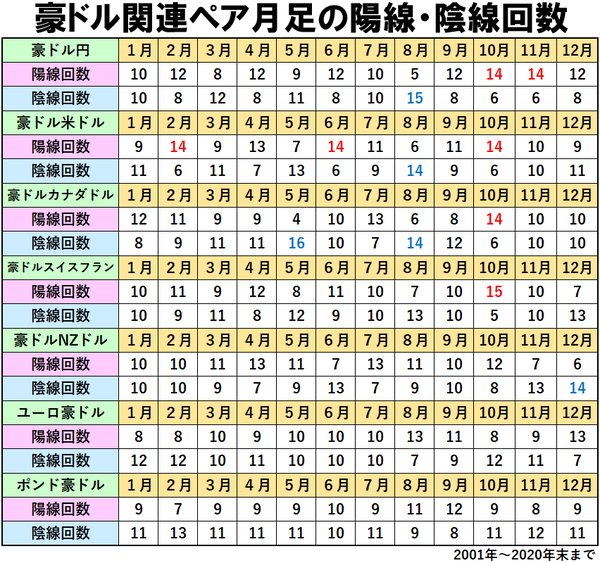
When looking at the monthly bars for AUD-related currency pairs, the number of bullish candles in October for AUD/JPY, AUD/USD, and AUD/CAD has occurred 14 times out of the past 20 years, while AUD/CHF has occurred 15 times, indicating a higher frequency of bullish candles.
14 times out of 20 means a 70% probability, and 15 times out of 20 means a 75% probability that bullish candles appeared in the past.
From this, we can see that October tends to be a month where the AUD is more likely to be bought—an anomaly.
2. Weekly Weather Forecast
Next, let's examine the weekly statistical data.
The table below shows the past 20 years of weeks between October 18 and 22, counting bullish candle frequency to calculate the probability of bullish candles.
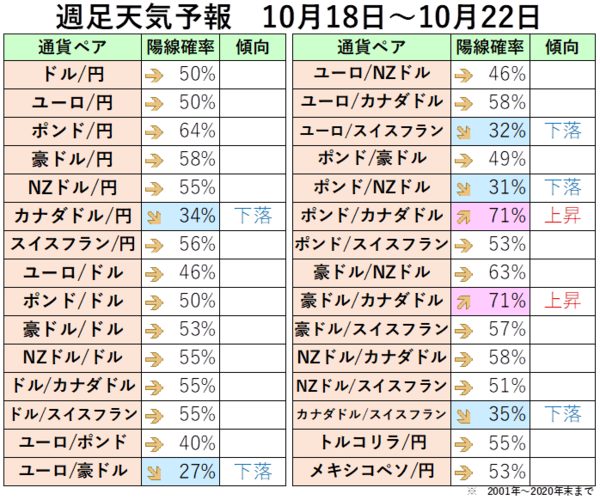
Looking at it, the bullish candle probability for USD/CAD (Canadian dollar pairs) is 34% for USD/CAD, and 35% for USD/CHF, which are relatively low, while GBP/CAD and AUD/CAD, where the Canadian dollar is the settlement currency, are high at 71%.
From this, we can infer that in the fourth week of October, the Canadian dollar tends to be sold slightly more—an anomaly.
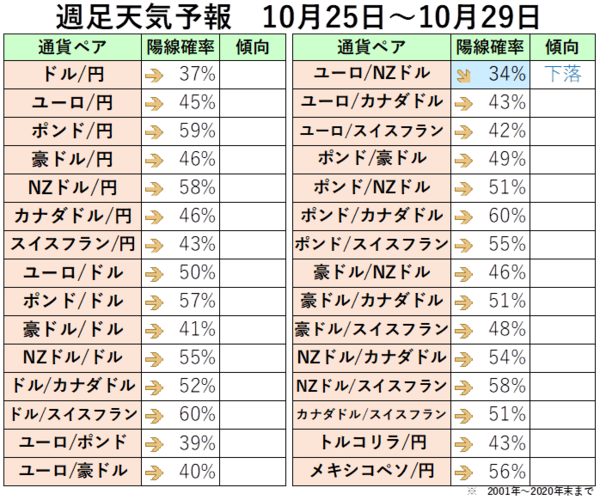
Next, for the fifth week of October weekly statistics, there were no pronounced trends or anomalies as shown below. Let us look forward to the daily statistics!
3. Daily Weather Forecast
Now, let’s review the daily statistics from October 18 to October 29.
The data below (posted in the subscriber-visible portion) counts the daily candles for October 18 of each year over the past 20 years and calculates the probability of bullish candles.