

Kawasaki Doruemon-ryu Exchange Rate Weather Forecast | Episode 25, August 23, 2021 edition
In FX, this series by Kawasaki Doruemon emphasizes the temporal element. As a "Forex Weather Forecast," it provides specific trading strategies from a statistical approach.
Kawasaki Doruemon Profile

Kawasaki Doruemon. Feeling the limits of discretionary trading, he searched for a system-trade method that could earn money with as little mental burden as possible. After various simulations, he completed the Guruguruto Train.
Blog:Kawasaki Doruemon's FX Blog
【Table of Contents】
- Monthly Weather Forecast (Monthly Crosses/Euro-related/Australian Dollar)
- Weekly Weather Forecast (August 23–27 / August 30–September 3)
- Daily Weather Forecast (August 23/24/25/26/27/30/31/September 1/2/3)
Hello! This is Kawasaki Doruemon.
This time, we will introduce the trends in the FX market from August 23 to September 3!
The Forex Weather Forecast is derived from past exchange rate data to calculate the anomalies for those dates.
1. Monthly Weather Forecast
First, let's introduce the monthly trend!
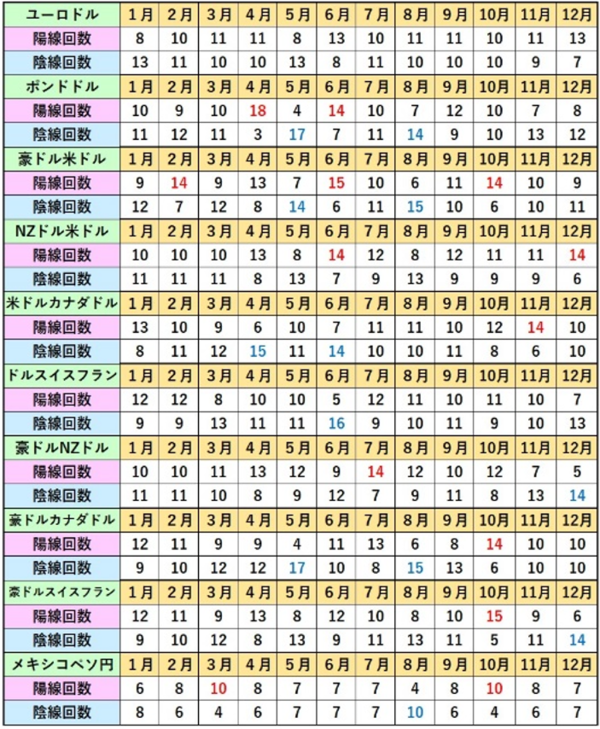
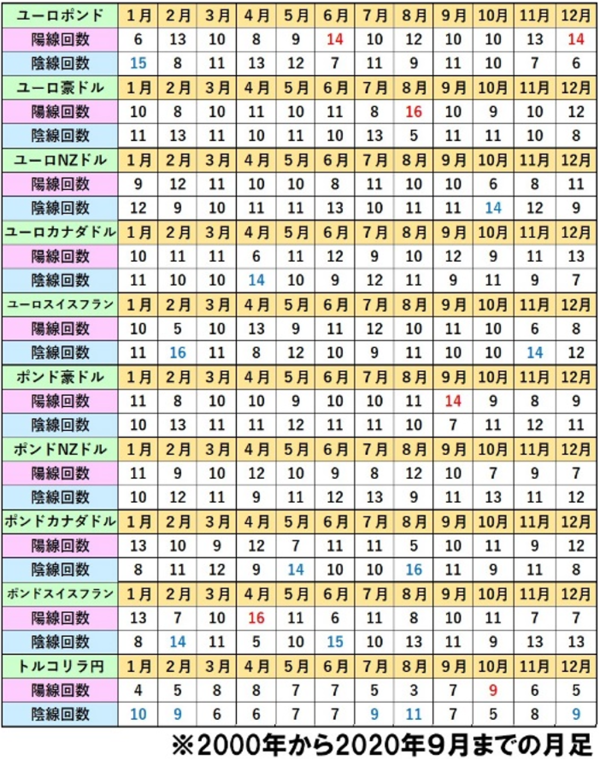
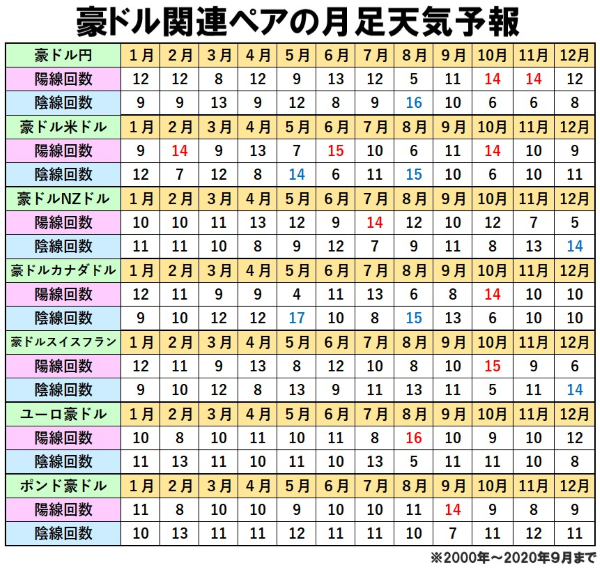
The table below lists the monthly charts for each currency pair from the year 2000 onward.
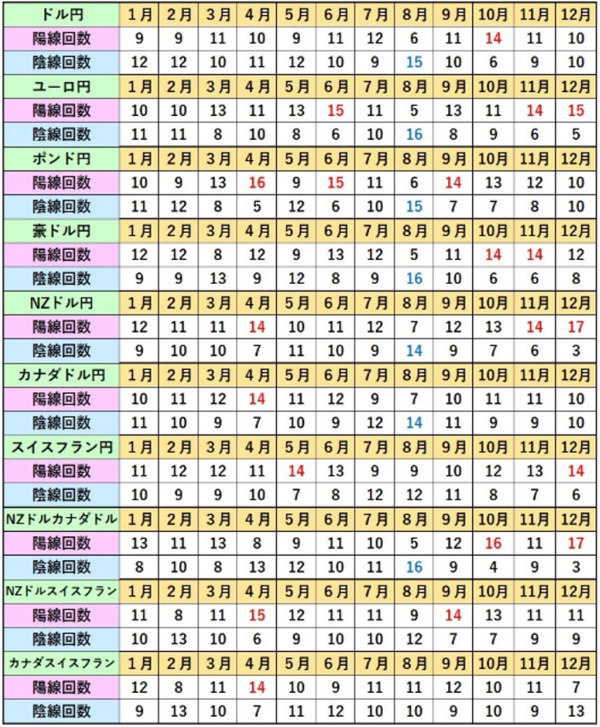
Looking at the August column for the extracted cross-yen monthly figures, the number of bearish candles for USD/JPY and GBP/JPY is 15 times out of the past 21 years; EUR/JPY and AUD/JPY have 16; NZD/JPY and CAD/JPY have 14, meaning most cross-yens tended to be bearish in August.
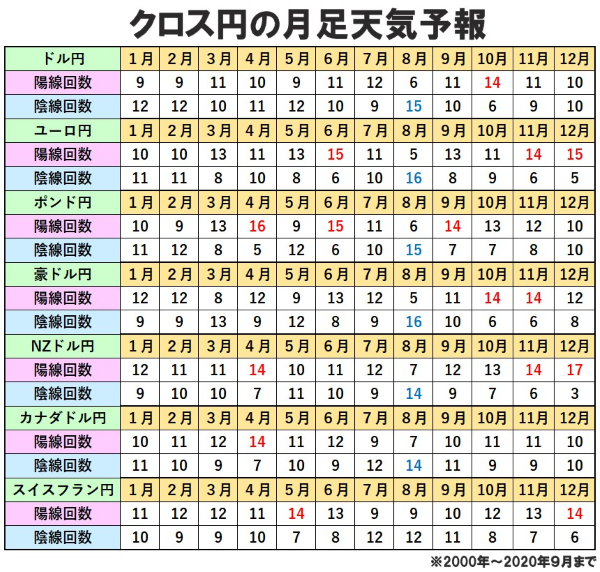
From this, we can infer that August tends to be yen-strengthening—a notable anomaly.
Also, regarding currency pairs involving the Australian dollar, August shows 15 bearish candles for AUD/USD and AUD/CAD, while the bullish candles for EUR/AUD where the AUD is the settlement currency total 16; indicating a tendency for the AUD to be sold in August.
Thus, August exhibits an anomaly where the AUD tends to weaken.
2. Weekly Weather Forecast
Next, let's examine the weekly data.
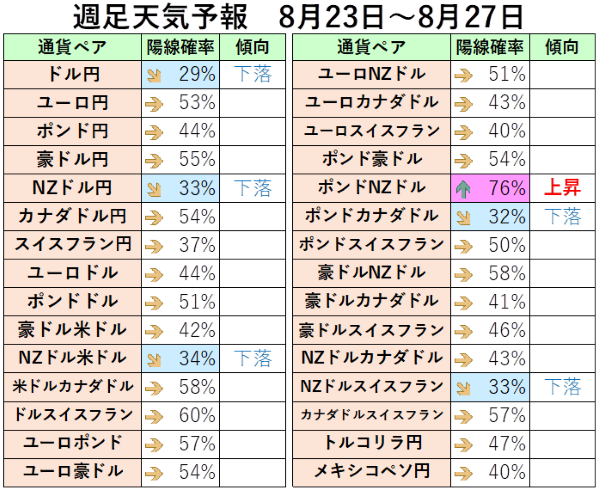
The table below shows the bullish probability calculated from weekly data from August 23 to August 27 in past years.
From the table, the bullish probabilities are 33% for NZD/JPY and NZD/CHF, 34% for NZD/USD (both relatively low), and 76% for GBP/NZD where NZD is the settlement currency, which is high.
From this, the fourth week of August tends to see mild selling pressure on the NZD—a notable anomaly.
Next, let's examine the weekly statistics data from August 30 (posted in the purchaser-only section).