After the event, a temporary trend of yen appreciation and dollar depreciation! (This week's market analysis for the week of 2016/09/26)
You’re really doing well, Bank of Japan. (;・∀・) Tala
Does it mean they’ll operate interest rates because they can’t manipulate the exchange rate (yen depreciation)?
I wonder how things will go from here.
There’s only anxiety left, but from now on the focus is likely to shift to the U.S. presidential race.
During Brexit, public opinion polls showed the pound fluctuating wildly, and this time I would rather you not have the dollar swing around based on each candidate’s poll numbers.
Dollar/Yen Market Analysis
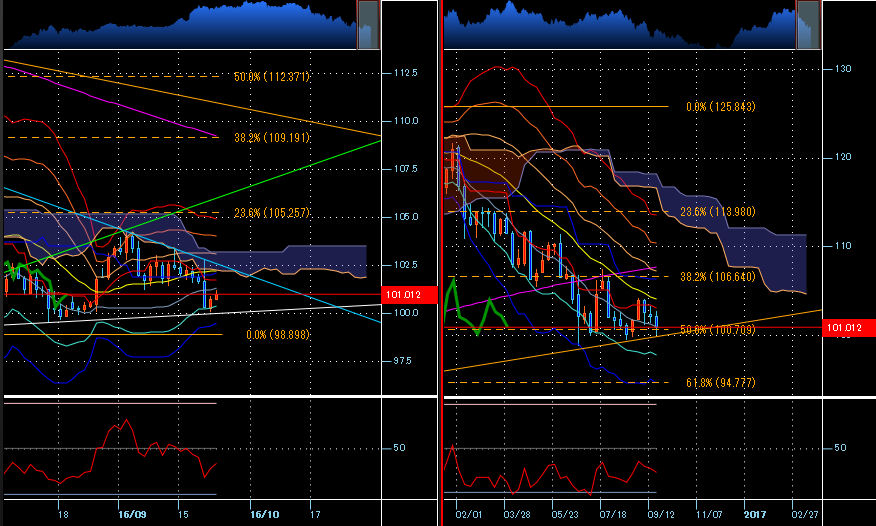
On the left is the daily chart and on the right is the weekly chart of the USD/JPY.
【Displayed Technicals】
SMA200, Bollinger Bands 21, Ichimoku Kinko Hyo, RSI14
The daily Fibonacci retracements are from the high on 2015/6/5125.843 yento the recent low98.898 yen
The weekly Fibonacci retracements are from the weekly low on 2011/10/3175.574 yento125.843 yen
The USD/JPY rose on the BOJ’s initial move, but it bounced nicely at the blue daily line I was watching. (・∀・) Nice!
I thought it would crash, but it instead found support near the white line around 100 yen, forming a very clean chart.
As for the direction, I’m looking lower, butI intend to trade in the direction of the break, using the blue and white lines as a basis.
However, the weekly bands are contracting and the daily bands are in a squeeze, so a false breakout is quite possible. I will strictly implement stop-loss and also consider counter-trend trades if a breakout fails.
From a market view, if the blue line is broken and the 9/2 high104 yen lowis breached, an uptrend becomes likely.
Below, if the 9/22 low of100 yen low is breached, it could run a bit.
In that case, the targets would be the most recent low’s98 yen high and the key level of95 yen.
This week, the U.S. presidential debates begin, and sudden news could cause large swings, so I’ll manage risk thoroughly.
【Pick-up Currency!】AUD/USD Market Analysis
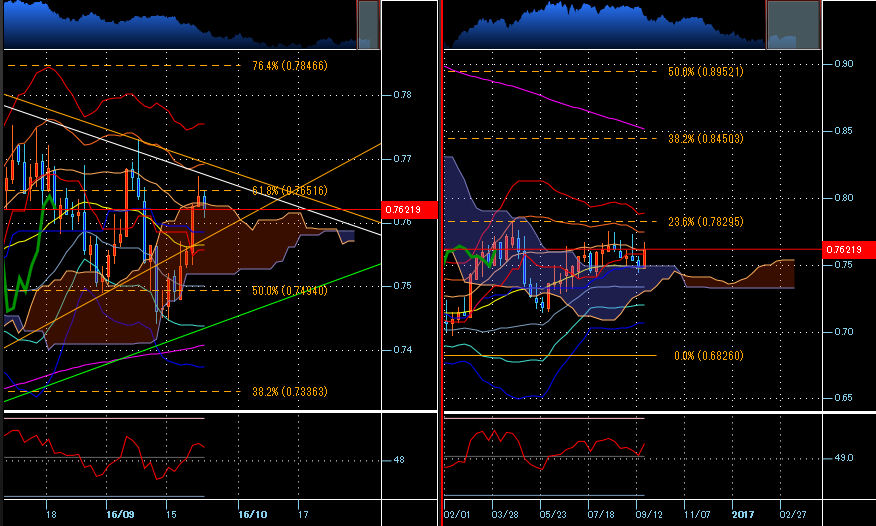
On the left is the daily chart and on the right is the weekly chart of AUD/USD.
【Displayed Technicals】
SMA200, Bollinger Bands 21, Ichimoku Kinko Hyo, RSI14
The daily Fibonacci retracements are from the high on 2015/5/140.81619 USDto the low on 2016/1/150.68260 USD
The weekly Fibonacci retracements are from the weekly high on 2011/7/251.10782 USDto0.68260 USD
If the dollar rises, I’m watching GBP/USD; if the dollar falls, I’m watching AUD/USD, but as noted in the USD/JPY analysis, I see the dollar heading lower, so I chose AUD/USD.
Three weeks ago, AUD/USD failed to break the white line and dropped sharply, yet it didn’t fall below the key level of0.75 USDand then recovered.
Remarkably, last week it even rebounded near the white line again. Σ(゜Д゜; Incredible!?
The levels to watch above are the0.77 USD lowand below the0.74 USD middle.
Which side breaks first will determine the next move.
By the time that level is reached, the white line and the line drawn above it will have broken, and the green line will also break, so the current triangular consolidation could very well transition into a trend.
In particular, since AUD has been in a long downtrend, if it shifts to an uptrend, I expect a larger price range to be possible.
Swap points also apply, so I definitely want to capture this trend... I’ve been fantasizing about it for a long time, but will that day come?
Will it come again to push the longs away? A check is needed. ( ´∀`)b Good!
Well then everyone, may you have explosive profits this week as well! (σ・∀・)σ Get!!