Volatile Dollar Exchange Rate, This Week…!? (This Week's Market Analysis 2016/9/12 Week)
Good morning, this is Neko Trader. (´・ω・`) Yo
Has anyone watched Sunday’s "Shikujiri Sensei"?
Atsushi from Ori☆Jiri was the teacher, and especially the lesson on India in the second period was interesting.
The content was about how continuing to struggle to change one's future from the dreaded dark history of the caste system led to the current worldwide leap forward.
“Only those who are not satisfied with the current situation can seize a brilliant future.”
It hits home, doesn’t it. (´・ω・`) Hmm
Indeed, the world of the markets holds infinite potential.
Although each person is different, traders all face the market unsatisfied with the status quo in order to gain brilliance.
And only a few traders succeed in grasping that brilliance.
It’s not a sweet world where you can just click and make a fortune.
So, with that, I would like to move on to this week's weekly analysis and trading strategy.
Dollar-Yen market analysis
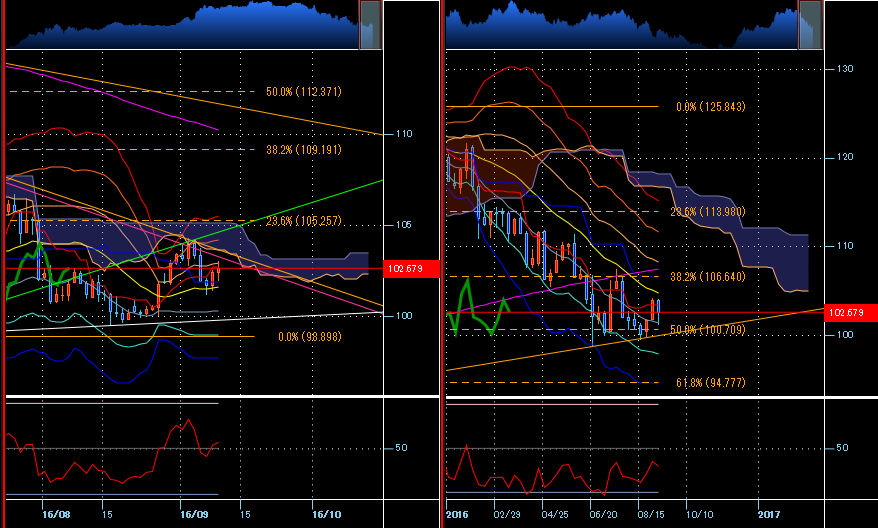
The left is the daily chart and the right is the weekly chart of the USD/JPY pair.
【Displayed technicals】
SMA200, Bollinger Bands 21, Ichimoku Kinko Hyo, RSI14
The daily Fibonacci levels are from the high on 2015/6/5125.843 yento the recent low98.898 yen
The weekly Fibonacci levels are from the weekly low on 2011/10/3175.574 yento125.843 yen
As you know? My USD/JPY long was stopped out immediately. (ノ∀`) Oh no
The retrace after the false move was fast, but last week ended with a small rebound.
This is because expectations for another US rate hike seem to be rising again.
It feels very much driven by speculation, so in such times I think it’s best to trade faithfully with the chart.
Technically, the weekly bands are likely to contract high, seemingly putting a temporary end to the downtrend, but it’s still in a neutral state where an upward trend cannot yet be said to have begun.
On the daily level, as mentioned, it’s a false-break pattern, but it’s also supported at the center line, making for a very difficult situation.
At minimum, until I clear the pink line I’ve been watching and draw a line above it, I’d rather refrain from going long.
That line isfrom the mid-103 yen to the low, the next target is the high of 9/2 at104 yen low to the weekly center line’smid.
If we break below this, the possibility of a genuine upward trend arises.
The downside is the 9/7 low101 yen low, breaking below here would make upward movement seem much heavier.
I’m bearish for this week unless the price breaks above the line, so I think I’ll be looking for shorting opportunities.
Euro-Dollar market analysis
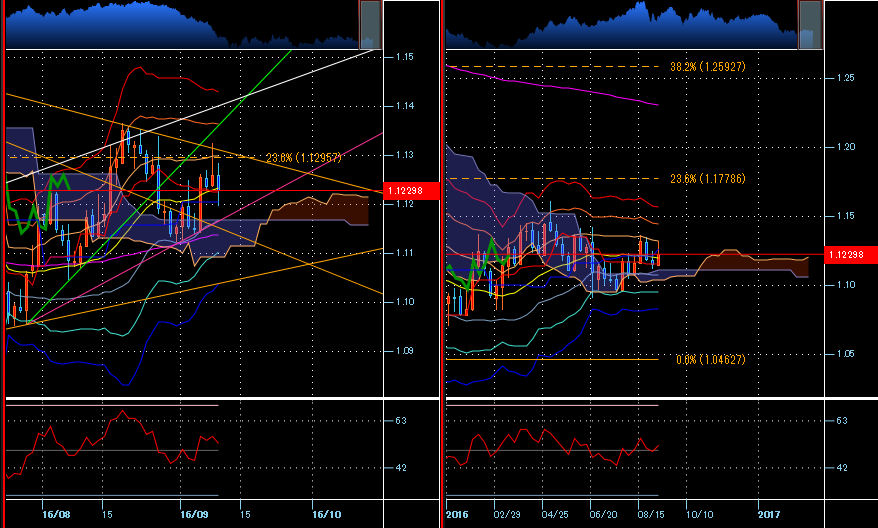
The left is the daily chart and the right is the weekly chart of EUR/USD.
【Displayed technicals】
SMA200, Bollinger Bands 21, Ichimoku Kinko Hyo, RSI14
The daily Fibonacci levels are from the high on 2014/5/81.39925 dollarsto the low on 2015/3/131.04627 dollars
The weekly Fibonacci levels are from the high of the week on 2008/7/141.60385 dollarsto1.04627 dollars
Last week's range, maybe because where we are now is quite to its liking, has been spending within a triangle consolidation. (;・∀・) Taraa
However, it’s getting tight and likely to break soon.
This week or next week there’s a high probability it will break in one direction.
Next week is the FOMC... timing is perfect.
Well, before that, I think it will lightly test the pink line, so if it breaks, I plan to short in the short term.
Also, if it breaks the upper and lower lines forming the triangle consolidation, if there’s any fundamental factor, it could be a different story, but I’d mainly go for counter-trend trading.
【PICK UP CURRENCY!】 Australian dollar vs U.S. dollar market analysis
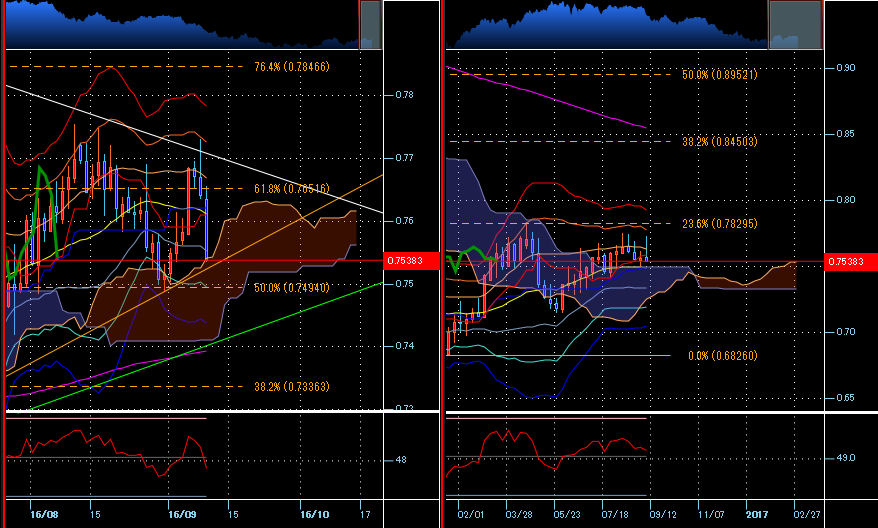
The left is the daily chart and the right is the weekly chart of AUD/USD.
【Displayed technicals】
SMA200, Bollinger Bands 21, Ichimoku Kinko Hyo, RSI14
The daily Fibonacci levels are from the high on 2015/5/140.81619 dollarsto the low on 2016/1/150.68260 dollars
The weekly Fibonacci levels are from the high of 2011/7/25 week1.10782 dollarsto0.68260 dollars
Well, this currency is definitely hot right now. (・∀・) Nice!!
Last Thursday, it finally broke through the white line I’ve been watching for a while.
But after that, the momentum didn’t continue, and it accelerated downward with a gravity-like force.
Friday’s rebound was also stopped by the daily Fibonacci level, and a downward expansion has begun, so obviously I’m short-biased, but I’d like to time it a little before entering.
Because, around 0.75 dollars is the previous low & daily Fibonacci & weekly center line & base line & cloud upper boundary. Σ(゜Д゜; frightening!?
Quite a cluster of important points, isn’t there?
I think it’s important enough that it’s not too late to short after breaking through here.
Conversely, if it doesn’t break, it may range again around 0.76 dollars and look for direction.
Well then, everyone, may you have explosive profits this week as well! (σ・∀・)σ Get!s!!