

Kawasaki Doraemon-ryu Foreign Exchange Weather Forecast|Issue 22 July 12, 2021 Edition
In FX, this series by Kawasaki Doruemon emphasizes the temporal element. As the Weather Forecast for FX, I will share specific trading strategies from a statistical approach.
Kawasaki Doruemon Profile

Kawasaki・Doruemon. Feeling limitations in discretionary trading, he explored systematic trading methods that would be as effortless and mentally light as possible to make profits. After various simulations, he completed the Gruguruto Train.
Blog:Kawasaki Doruemon's FX Blog
【Table of Contents】
- Monthly Weather Forecast
- Weekly Weather Forecast (July 12–July 16 / July 19–July 23)
- Daily Weather Forecast (July 12/13/14/15/16/19/20/21/22/23)
Hello, I’m Kawasaki Doruemon!
I collect data from past FX markets, calculate the anomalies for those dates, and publish them as FX Weather Forecasts.
This time, I will introduce the trends in FX from July 12 to July 23!
1. Monthly Weather Forecast
First, let’s introduce the monthly trend!
The table below counts the monthly data for each currency pair from the year 2000.
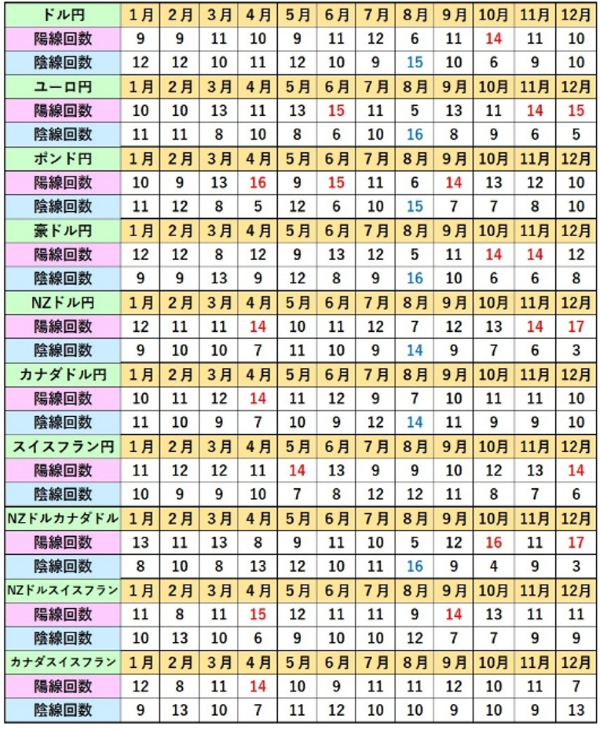
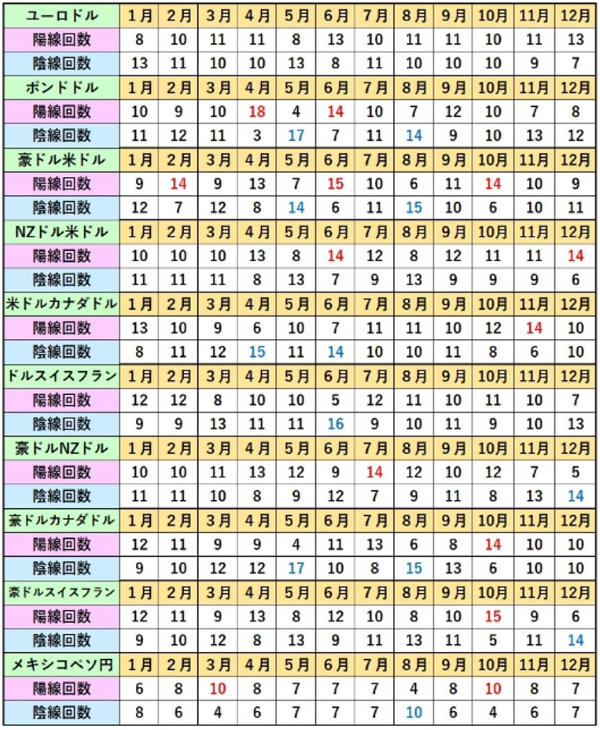
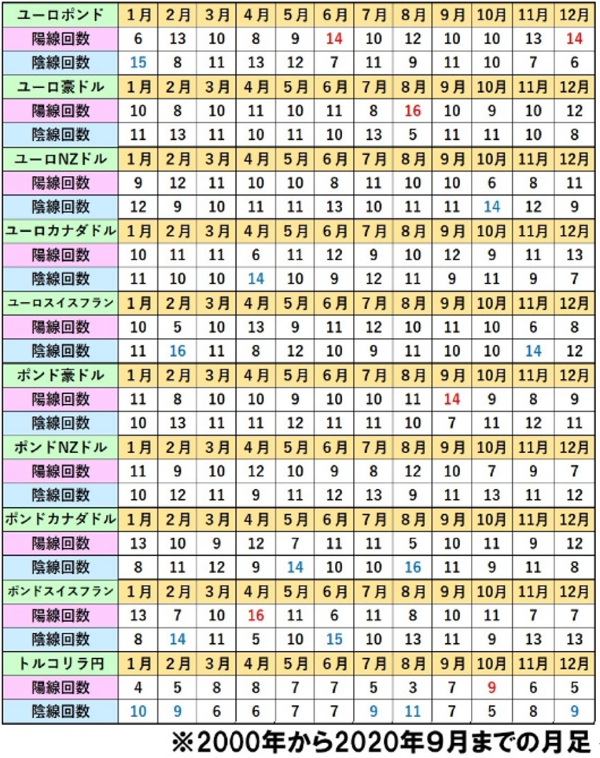
From what we can see, there were no notable trends or anomalies in July’s monthly data.
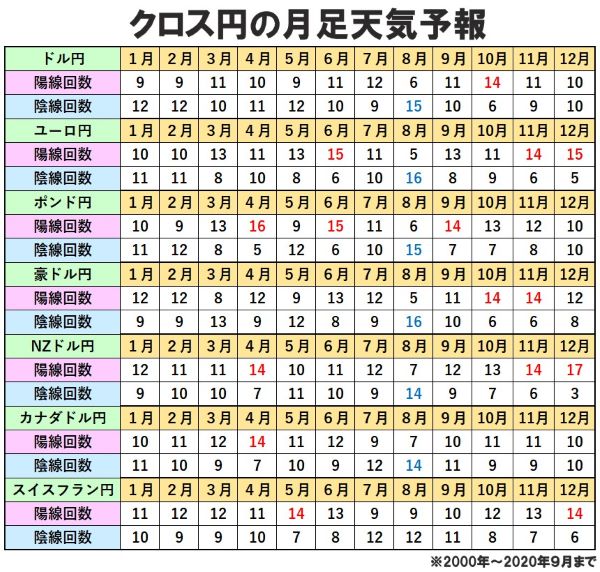
However, in August there is a once-a-year strong yen appreciation and AUD weakness tendency. So, when holding long positions in cross-Yen pairs in late July, caution is needed.
Details for August’s monthly data will be introduced in another article. Please look forward to it!
2. Weekly Weather Forecast
Next, let’s look at the weekly data.
The table below shows the weekly data from July 12 to July 16 and the calculated bullish (positive) probability.
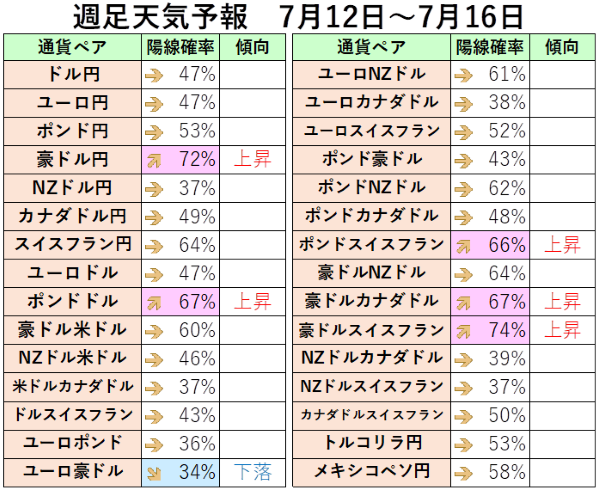
From what we can see, for AUD-related currency pairs, AUD/JPY bullish probability is 72%, AUD/CAD is 67%, AUD/CHF is 74%, while the euro/AUD, with AUD as the settlement currency, is 34% and relatively low.
From this, there is a slight tendency/anomaly for AUD to be bought in the third week of July.
However, note that for some AUD-related currency pairs, such a tendency does not appear.
Next, let’s look at the third week’s weekly data (the publicly shared portion for purchasers).