

Kawasaki Doruemon-style Exchange Weather Forecast | Episode 21, June 28, 2021 ~
In FX, this series by Kawasaki Doruemon places importance on the temporal element. As a "Forex Weather Forecast," we will share concrete trading strategies derived from a statistical approach.
Kawasaki Doruemon Profile

Kawasaki Doruemon. Feeling limits in discretionary trading, he seeks a system trading method that is as mentally effortless as possible and profitable with minimal burden. After various simulations, he completed Guruguru Train.
Blog:Kawasaki Doruemon's FX Blog
【Table of Contents】
- Monthly Weather Forecast (Dollar-Strength Monthly Weather Forecast)
- Weekly Weather Forecast (June 28–July 2 / July 5–9)
- Daily Weather Forecast (June 28 / June 29 / June 30 / July 5)
Hello, I’m Kawasaki Doruemon! I extract data from past exchange rate movements and compute the daily anomalies to deliver Forex Weather Forecasts.
This time, I will introduce the currency trends from June 28 to July 9!
1. Monthly Weather Forecast
First, let’s introduce the monthly trend!
The table below lists the monthly closes for currency pairs involving the dollar, counted from 2000.
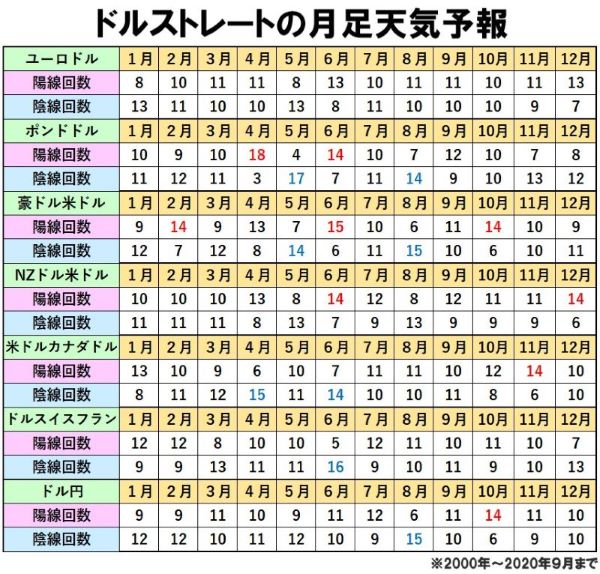
Looking at the June column, the number of bullish candlesticks for GBP/USD is 14, AUD/USD is 15, and NZD/USD is 14; while USD/CAD, where the dollar is the base currency, shows 14 bearish candlesticks, and USD/CHF shows 16 bearish candlesticks, indicating many declines.
From this, June tends to be a month where the dollar is sold, showing an anomaly.
In particular, USD/CHF stands out, as it shows bearish candlesticks with about a 76% probability when translated into probability terms.
2. Weekly Weather Forecast
Next, let’s examine the weekly data.
The table below calculates the bullish probability from the weekly data for June 28 to July 2 in the past. This is the anomaly at the end of June.
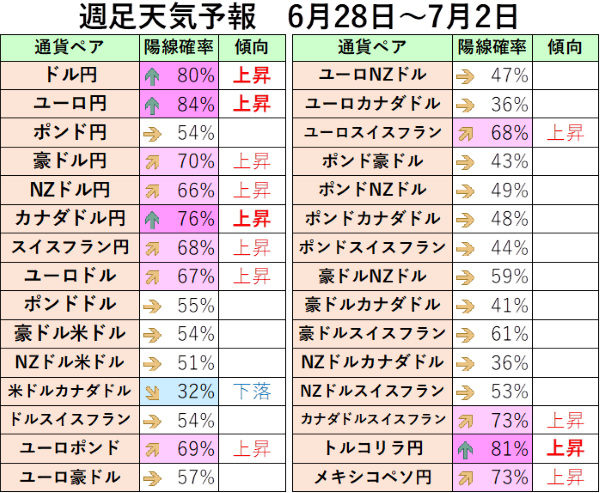
Looking at the data, bullish probabilities are 80% for USD/JPY, 84% for EUR/JPY, 70% for AUD/JPY, 66% for NZD/JPY, 76% for CAD/JPY, and 68% for CHF/JPY, indicating high bullish probabilities.
From this, there is an anomaly that at the end of June, the Japanese yen tends to be sold and cross-yen pairs rise.
Next, let’s look at the weekly weather forecast for the second week of July. The table below (published for subscribers) shows the bullish probability calculated from the past weekly data for July 5 to 9.