

MT4 Harmonic Three Drives System Search Indicator


W top resembles Head and Shoulders!
Three Drives, The 5-0, AB=CD — signals arrows for three patterns with email and alert notifications!
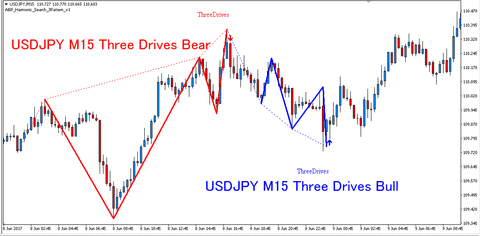
The image above shows USDJPY 15-minute chart with Harmonic Three Drives Bull and Bear signal examples.

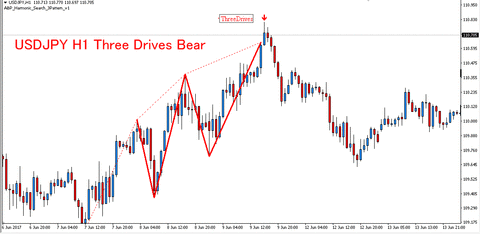
The image above shows USDJPY 1-hour chart with Harmonic Three Drives Bearish example.
If the shape is solid, it evokes capturing the peak of the Elliott fifth wave.
※ Fibonacci and reference SLLine are displayed simultaneously with the signal, email, and alerts.
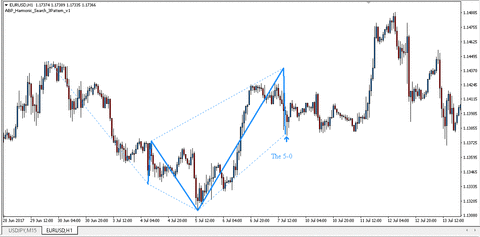
The image above shows EURUSD 1-hour chart with Harmonic The 5-0 Pattern Bullish example.
Timing similar to a half-price pullback after the first Elliott wave from a W bottom.

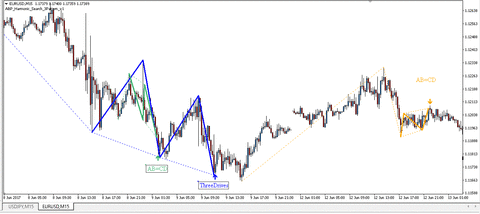
The image above shows EURUSD 15-minute chart with Harmonic AB=CD pattern Bullish and Bearish examples.
For the Bullish AB=CD pattern, including pullback cases, the idea is to form a W bottom at the first and second bottoms and then rebound.
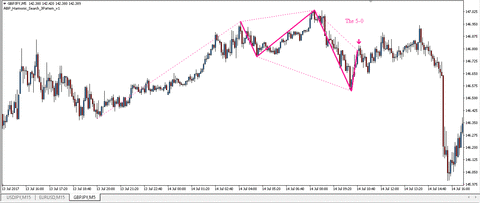
The image above shows GBPJPY 5-minute chart with Harmonic The 5-0 Bearish example.
GBPJPY on the 5-minute chart can also detect The 5-0 pattern similar to Head and Shoulders.
It’s good to place the stop loss at the apex.
※ Arrows and pattern names are color-coded.
※ When configuring charts, the detection counts for each pattern are displayed in the message area separately for Bullish and Bearish.
Harmonics that Western and American institutional investors are watching
This is an indicator focused on detecting the Three Drives, The 5-0, and AB=CD patterns that Western institutional investors are paying attention to.
The three patterns above are similar to W tops and Head and Shoulders, among others.
Harmonics combine chart waves with Fibonacci ratios to narrow down potential reversal points, aiming to pinpoint tops and bottoms.
Win rate is said to be around 70%–90%, but even if we narrow tops and bottoms, I view these as condition-dependent figures.
If the bullish pattern occurs on rising lows and the bearish pattern on falling highs, the 70%–90% win rate is understandable.
In other words, there is a plausible hypothesis that the pullbacks during uptrends and the rallies during downtrends are fairly well predicted.
Technical Trade Blog Ranking


