
Kawasaki Doraemon-style Currency Weather Forecast | Episode 20, June 14, 2021 edition
In FX, this series by Kawasaki Doruemon emphasizes the temporal element. As a “Forex Weather Forecast,” we will share concrete trading strategies from a statistical approach.
Kawasaki Doruemon Profile

Kawasaki Doruemon. Feeling limited by discretionary trading, he sought a system trading method that could be profitable with as little mental burden as possible. After various simulations, he completed Guruguru Train.
Blog:Kawasaki Doruemon’s FX Blog
【Table of Contents】
- Monthly Weather Forecast (Dollar-Strait Monthly Weather)
- Weekly Weather Forecast (June 14–18 / June 21–25)
- Daily Weather Forecast (June 15 / June 16 / June 22 / June 24)
Hello, I’m Kawasaki Doruemon!
This time, I will introduce the forex trends from June 14 to June 25!
I collect data from past forex markets, compute the day-to-day anomalies, and distribute them as Forex Weather Forecasts.
1. Monthly Weather Forecast
First, let's introduce the monthly trend!
The table below shows the monthly charts for currency pairs related to the dollar index counted from 2000.
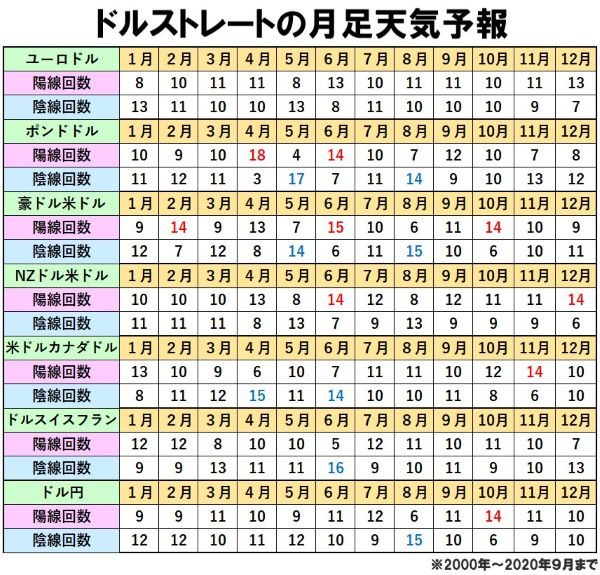
Looking at the June column, the number of bullish candles for GBP/USD is 14, for AUD/USD is 15, for NZD/USD is 14, while USD/CAD, where the dollar is the base currency, has 14 bearish candles, and USD/CHF has 16 bearish candles.
From this, June tends to be a month where the dollar is sold—anomaly. In particular, USD/CHF shows about a 76% probability of bearish candles when converted to probability, so it deserves attention.
2. Weekly Weather Forecast
Next, let's look at the weekly data. The table below shows the bullish candle probability calculated from weekly data from June 14 to June 18 in the past.
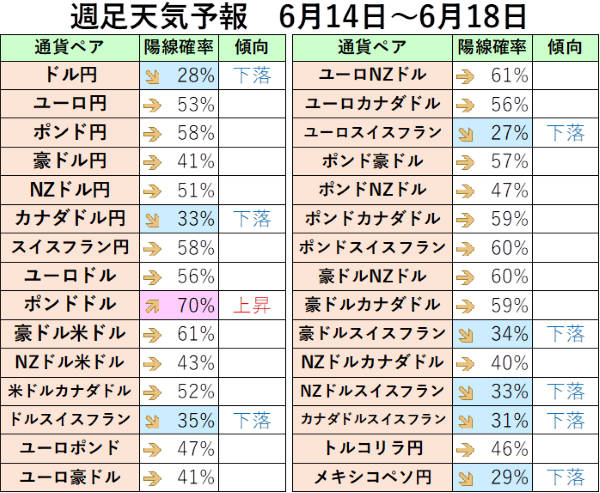
From the data, the bullish candle probability for USD/CHF is 35%, for EUR/CHF is 27%, for AUD/CHF is 34%, for NZD/CHF is 33%, and for CAD/CHF is 31%. The bullish probability for most CHF-related currency pairs is low.
From this, the third week of June shows a tendency/anomaly where the Swiss franc tends to be bought.
Next, let's look at the weekly weather forecast for the fourth week of June.
The table below (published in the purchasers’ section) shows the bullish candle probability calculated from weekly data from June 21 to 25 in the past. It appears that from June 21 onward, there is a tendency related to NZD pairs.