~No sign indicating a buying opportunity~Tetsuo Inoue, Market Trends: Trend 327
Note: This article is from the Investment Salon [Inoue Tetsuo - Market Trends]
Reprinted from the email newsletter published on July 18, 2017.
============================
Trend 327: "Chick and Hen" is not a question
============================
(This "Trend" also covers moves toward global rate hikes, etc.)
Although this is an ongoing series, please excuse any awkward formatting as I also write about market conditions.
Even during Japan's three-day weekend, the U.S. market was extremely quiet. As noted in MD, on Friday and last night the NYSE volume fell below 700 million shares, and in response to the ultra-quiet trading, the so-called VIX (fear index) fell for three consecutive trading days by more than 10%.
We have lamented the lack of volatility this year, yet a three-day stretch of the VIX below 10% has never happened before. This is the first time since the measurements began in 2005, i.e., the first time in more than ten years, that the market has not felt fear for three consecutive days.
As a matter of course, No-Sign continues, and the Nikkei's closing price has not deviated by 1% from the previous day's close for 30 trading days.
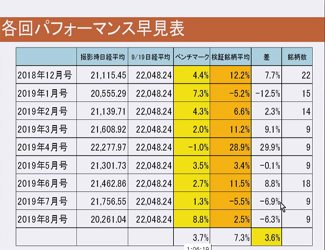
So what about foreign investors' movements? The slope of the weekly total of spot + futures purchases from the 5th week of May (week ending 6/2) to the 3rd week of June (week ending 6/23) shows a net buying tilt of a little over 1.15 trillion yen in Japanese stocks (during this period the Nikkei rose 446 yen). After that, there was a net buying of 1.4 billion yen and a net selling of 190 billion yen, and in those two weeks the Nikkei average fell by 204 yen.
I will update the graph of foreigners' five-week cumulative buys/sells and the five-week change in the Nikkei that I previously showed.
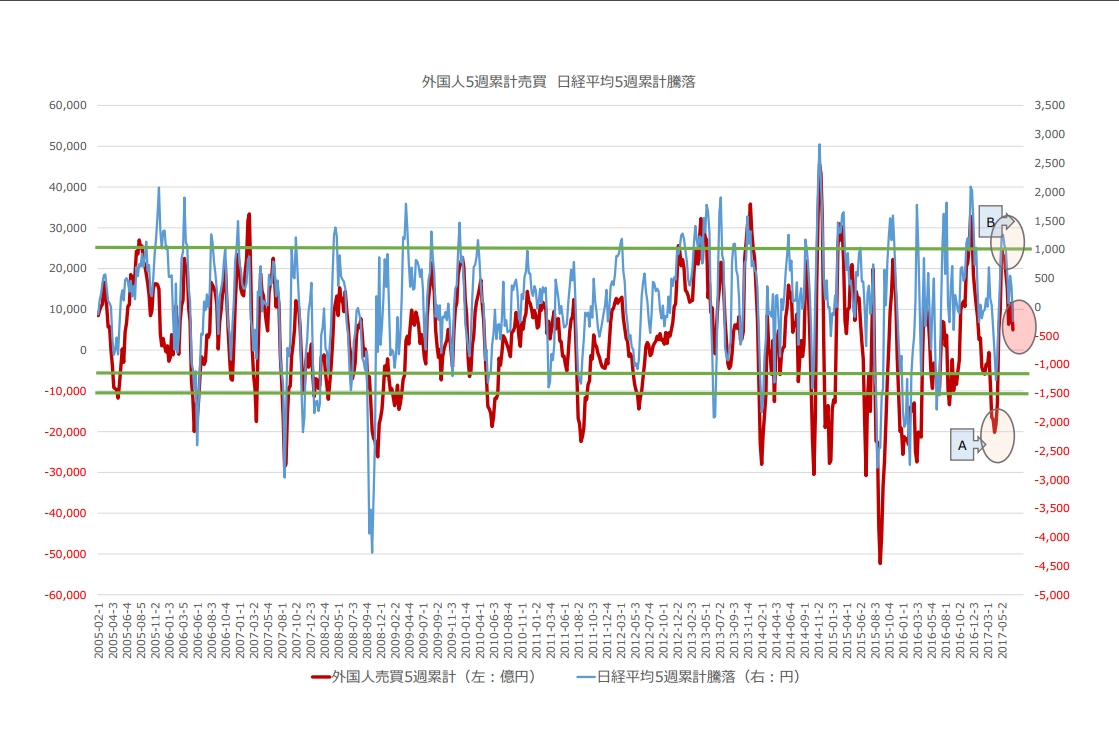
The gist of this graph is that, historically, when foreigners' five-week cumulative buying (red line) reached around 2 trillion to 2.5 trillion yen, the Nikkei rose by about 700 yen to over 1000 yen (top two green auxiliary lines). Subsequently, when five-week cumulative selling reaches around 500 billion to over 1 trillion yen at some point, the Nikkei falls by about 1000 yen to over 1500 yen (bottom two green auxiliary lines).
Recently, first in part A (the second week of April) there was a 2 trillion yen class net selling and about a 1200 yen drop in the Nikkei, then in part B (the second week of May) there was a 2.5 trillion yen net buying and a 1250 yen rise in the Nikkei, and now it has fallen to the circled area.
From this graph, you can see that the buying opportunity is still in the future.
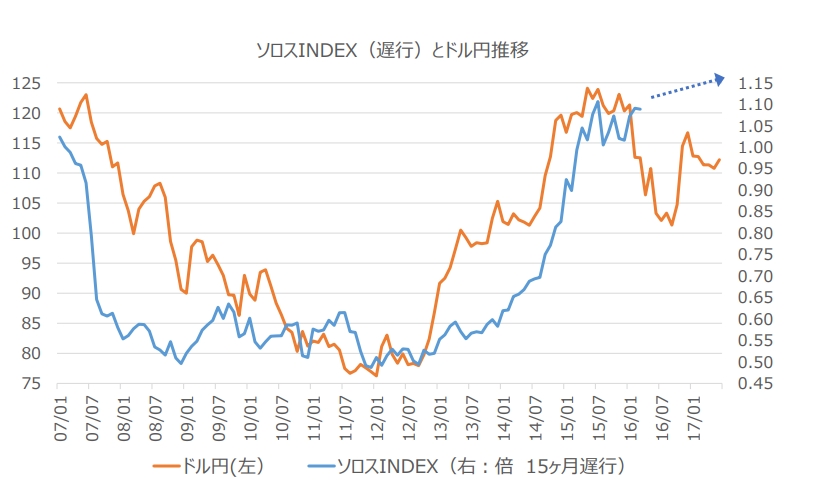
Now, in last Friday's "Trend," we posted the Soros Index and the USD/JPY chart.
To recap, using the monetary base of Japan and the United States, “Soros Index = Japanese monetary base / U.S. monetary base in yen terms,” the movement is close to the USD/JPY chart.
What happens to the Soros Index from here is clear.
That is because the BOJ announced continued expansion of the monetary base under the QQE with Yield Curve Control since last autumn, while in the U.S., the Fed has floated a "trial balloon" toward shrinking its balance sheet. As shown by the blue line last Friday, this index may rise, but is unlikely to fall at least until the BOJ changes course on the above measures, and the index consequently exists as a supporting factor for dollar strength and yen weakness as shown by the red line.
Now, in the Soros Index and USD/JPY chart shown last Friday, I wrote about two periods.
These are the periods since the start of the Abenomics rally: (1) a period where the directional sense was not wrong, but the yen depreciated too rapidly; (2) a period where last year's direction diverged (and later the divergence resolved).
Here, occasionally, a technical analyst might say, "Hey, that's not right," so I deliberately show such a graph.
The attached second chart explains the movements of these two periods by lagging the Soros Index by 15 months and including the USD/JPY chart.
At first glance, this graph seems to have greater explanatory power, but it contains a logical contradiction. I would like to leave that as today's homework.
Hint: If it's "egg and chicken," that's a question, but "chick and chicken" is not.
Continued at the Investment Salon!
============================

============================