Once again, the Dow's bottom was nailed precisely — Tetsuo Inoue's e-newsletter "Market Trends" (2019.10.15)

"Why did Japan's financial institutions, trust banks, securities firms, and hedge funds around the world sign contracts with him?"
— The answer is here.
Unlike anyone else. No one can imitate.
With overwhelming persuasiveness
"An invitation to 'Inoue World'."
What is Inoue Tetsuo's "Market Trend"?
For nearly 30 years, he has been active as a fund manager and strategist for institutional investors, hedge funds, and mutual funds (publicly offered and privately placed). This is a monthly subscription newsletter content that not only discusses the current "Market Trend" but also reveals the direction of the indices using original technical charts that are unique in the world.
Main Contents
◆ "Sign""…" On weekdays every morning, we report how many of the five signals of overheating and being oversold for the Dow and the Nikkei are lit.
◆ "Market Data"… Every weekday morning, we report the previous day's Japan market, the recently concluded stock indices for Europe and the US, the VIX, crude and gold futures prices, and the latest actuals for the Chicago Nikkei futures.
◆ "Trend"… This is the main content delivered every weekday morning in this newsletter.
The analysis of the current market situation, supply-demand factors, and original technical analysis reads the market direction. It may seem difficult at first, but once you get used to it, you’ll surely get hooked.
Even now, this is the only place where individual investors can read the strategies that are supported by many professional investors.
First, compare the newsletter’s latest issue title that hit the recent bottom with the chart.
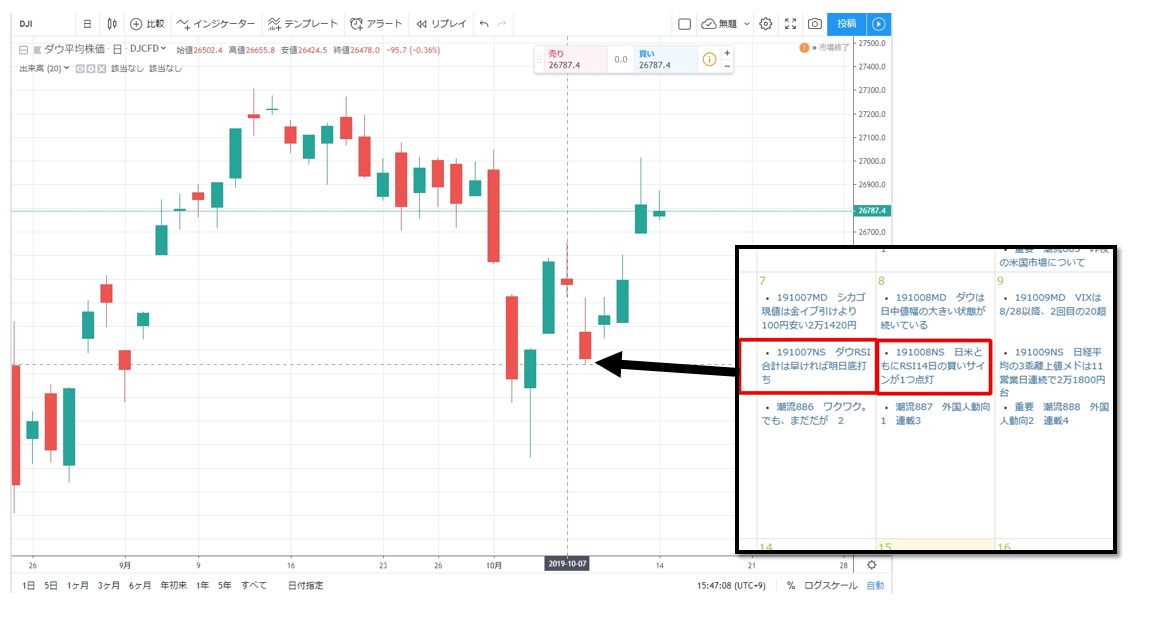
(From the Trading View chart, Dow Jones Industrial Average)
10/7 Dow RSI bottom might be in tomorrow; on 10/8 both the US and Japan show one buy signal lit. Since then the Dow rose, perfectly matching the rebound from the bottom!
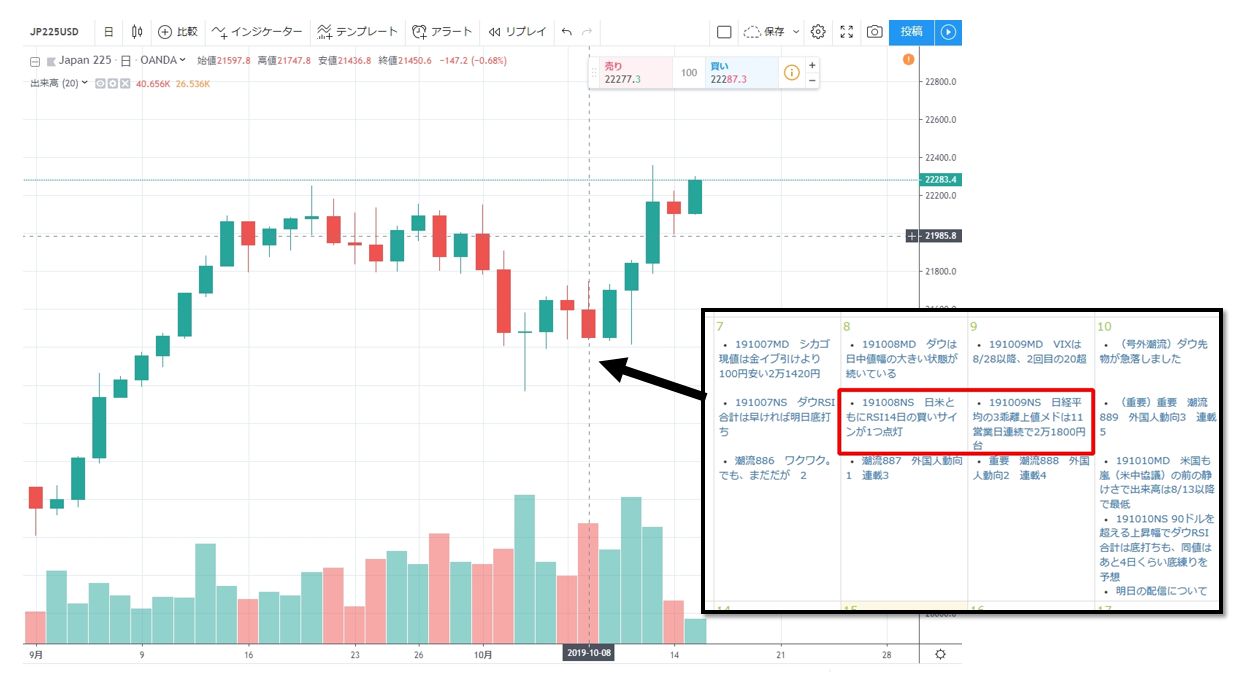
(From the Trading View Nikkei chart)
From one buy signal lit on 10/8, it surpassed the initial target of 21,800 yen and continues to rise.
Now, let's quote today's 10/15 "Market Trend" newsletter and reexamine the market flow since last week.
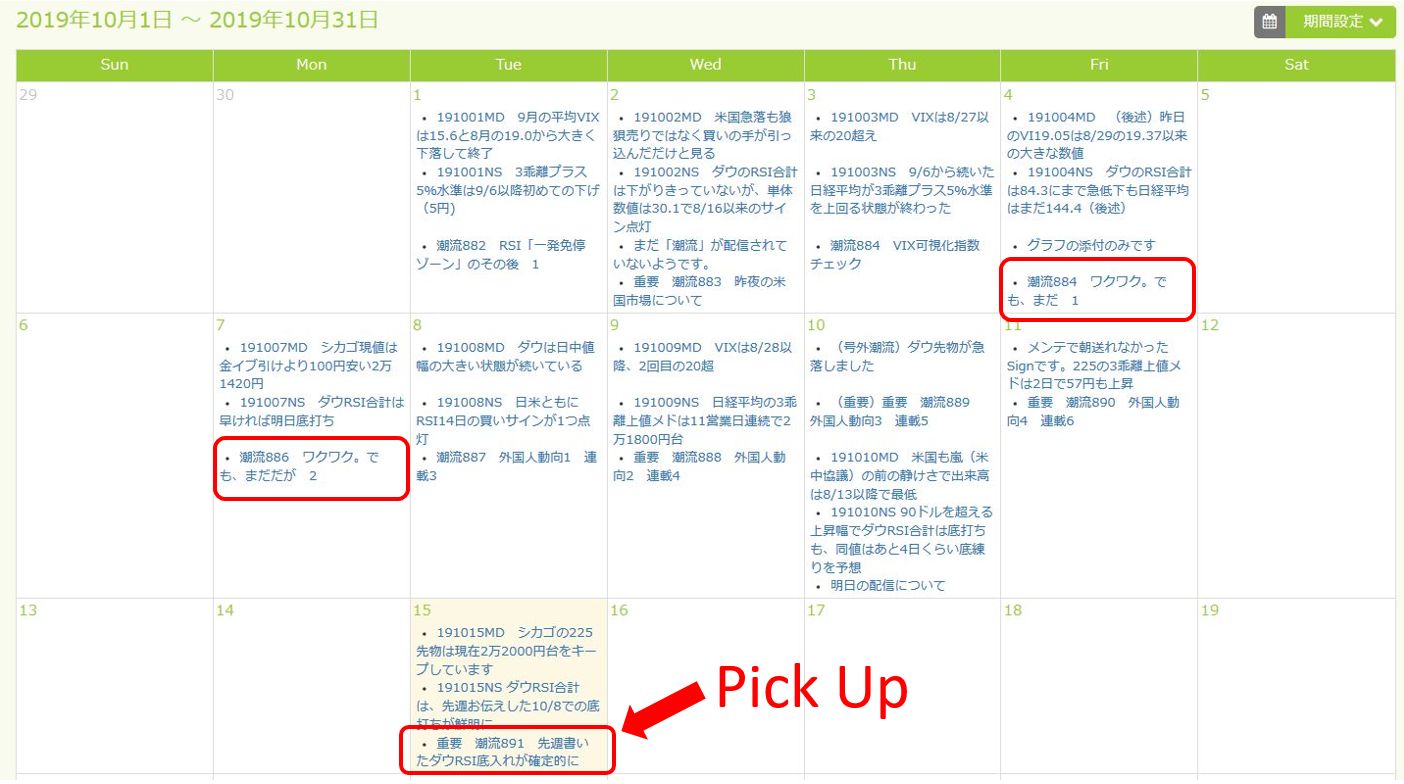
2019-10-15 09:37 delivered
From "Important Trend 891: Dow RSI bottoming confirmed as described last week"
Last Friday I attached a table of foreign futures activity during the dividend-taking week and the subsequent five weeks. Since this content isn’t something to逃げるものでも、旬があるものではないことから喫緊お伝えすべき、先々週末から書いているダウのRSI合計が底打ち確定となったので、このことを書くこととする。
First, on last Monday's"Trend 886: Excited, but not yet — 2" (Note 1)I wrote that, “It is fairly common for a bottom to form before reaching the 'out-of-speed-limit level', and regarding the U.S. market, the bottoming momentum is highly likely to pick up going forward (though no one has said so yet).”
And regarding the Japanese market moving forward,"Normally, technically, even if the Dow bottoms, the Nikkei Average would take longer to rebound; but in this case, I sense a possibility of a different development. The scenario is 'bottoming at a mid-level → rebound.'This aligns with the scenario that began with the September-end decline: the time-duration correction is necessary, but not accompanied by a large price-range decline, and afterwards there is a strong possibility of a rebound, with the Dow possibly updating its all-time high (since five signals lit once).
Subsequently, regarding the Dow RSI total, on 10/9 (last Wednesday) I delivered"Important Trend 888: Foreign Investor Movement 2, Series 4"stating, "(In the market closed this morning, the Dow fell by 313.98 dollars (1.18%))If the Dow rises by more than 90 dollars in tonight’s U.S. market, that figure will exceed this morning’s figure, and while bottoming (confirmation) cannot be declared, it would mark the first time the previous day's figure is surpassed in this correction." The Dow then rose 181.97 dollars, exceeding 90, thereby forming a temporary bottom; the RSI total at the time of the 313.98 drop (69.11%) subsequently rose to 69.81% → 72.16% → 73.85%, and as of this morning it stood at 76.53%.
Graph 1 is attached to show that the bottom was essentially reached without hitting the 'out-of-speed-limit level'.
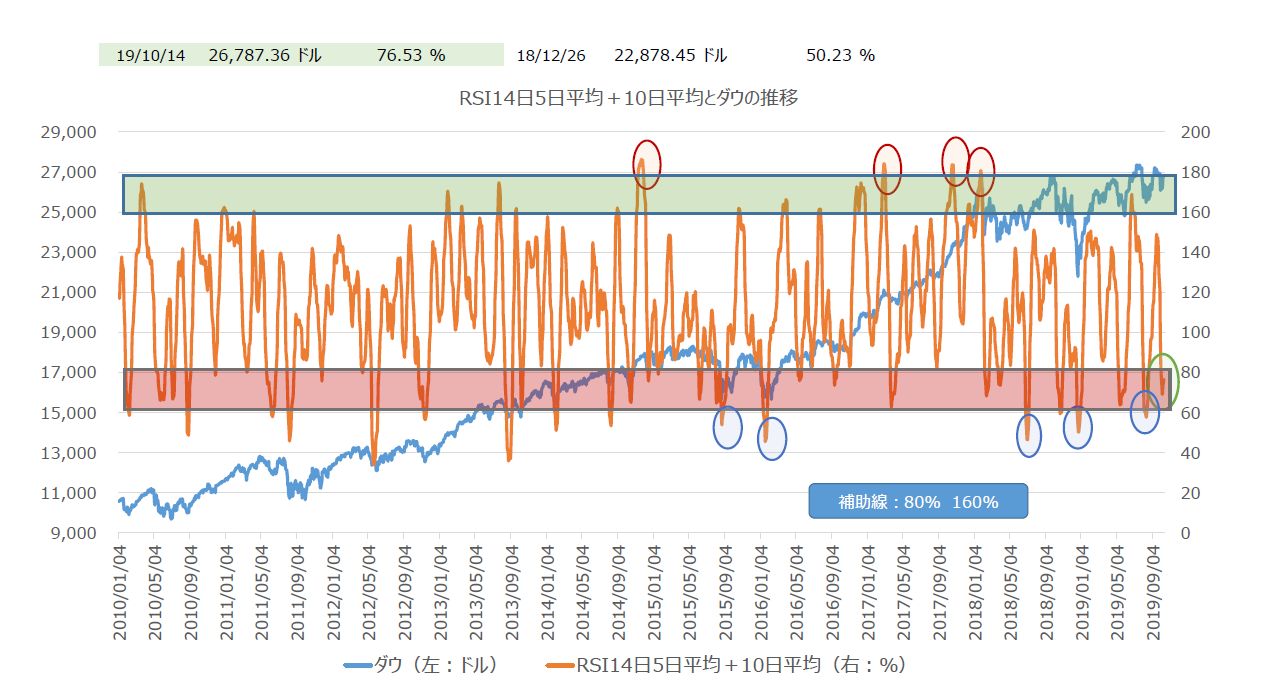
※Graph 1
And regarding the lagging Nikkei RSI total (to be attached as Graph 2), as of last Friday it had fallen to 81.61%. This time, compared with the Dow, it remained more than 50 percentage points higher, and I explained why this is, and noted the possibility that the bottom could form without reaching the 'out-of-speed-limit (60%–80%)' level; the 81.61% figure—being right at the speed-limit edge—may become the bottom.
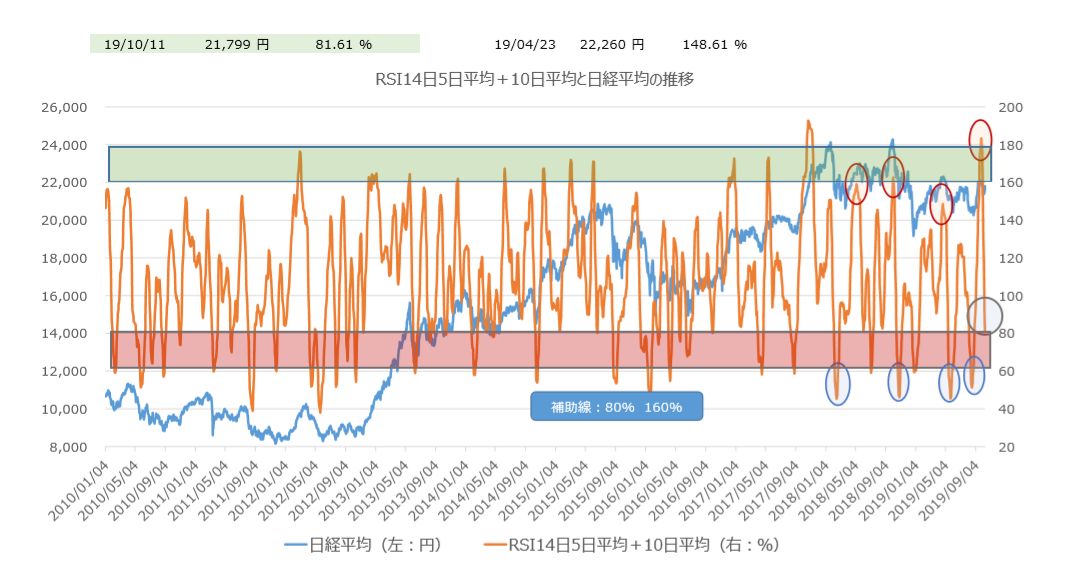
※Graph 2
Under the current conditions,if today’s close of the Nikkei Average is above 21,791 yen, a bottom will have formed; if it closes above 21,866 yen, we will avoid even a small false signal tomorrow by not dipping below last Friday’s figure.
The opening note that “no one is saying it yet” about the bottoming momentum is indeed rising, but I will also attach Graph 3 for the monitoring of the 3-discrepancy total (Dow) 5-day moving average as further evidence; please review the left-hand historical numbers. You will see bottoming indicated at the same time as the RSI total.
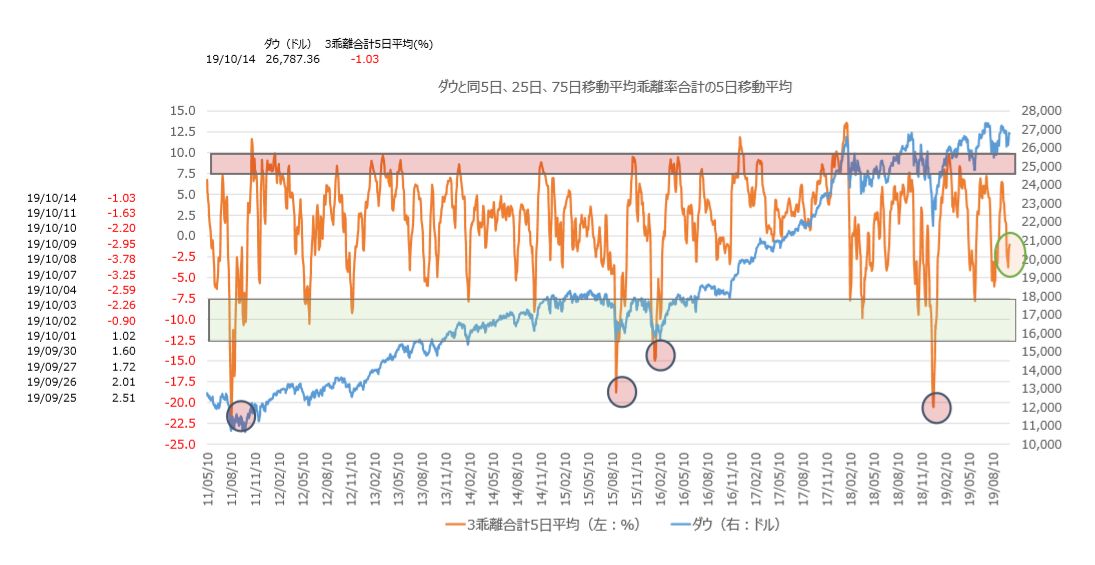
※Graph 3
※1 Trend 886: Excited, but not yet — 2
Last Friday's Trend numbering was incorrect; it should have been 885. Today’s content continues, and the word “まだ” has changed to “まだだが.”
On Friday I wrote about the 3-discrepancy total; as noted in Sign today, if the closing price remains as it is, the Dow RSI total may bottom tonight; so Graph 1 is attached for that purpose. Last Friday it entered the 60%–80% zone of the “out-of-speed-limit level” with 79.53%.
Given that the most recent peak did not reach the upper 160%–180% “out-of-speed-limit level” to form a top, technically (unless there is a big catalyst), it is common for the downside to bottom without hitting that level, and for the U.S. market the bottoming momentum is very likely to rise this time as well.
Meanwhile, in Japan, the Nikkei Average RSI total was still only 130.96% as of last Friday, making a sizable gap of over 50 percentage points with the Dow—a quite rare situation.
This reflects, as noted last Friday, that Nikkei’s September rise was the top among major indices.
Earlier, I noted the Dow RSI total’s most recent peak; actual value was 148.98% on 9/19, while Nikkei’s peak was 183.34% on 9/26. In other words, the Dow’s peak came about a week earlier, and the Nikkei’s peak was about 35 percentage points higher, leaving the current gap between the two.
Normally, technically, even if the Dow bottoms, the Nikkei would take longer to rebound; however, I strongly feel there is a possibility of a different development this time. The scenario is "bottoming at an intermediate level → rebound."
The discussion is moving toward a conclusion, but here is the third technical chart for the imminent U.S. market bottom (the first was last week’s attachment "Three-Discrepancy Total Moving Average and Raw Data," the second was "RSI Total"). It is the "VIX Visualization Index."
On the left are the latest peak values; note that the downward move has been shrinking in recent days. The graph’s shape is still steeply downward, but watching the daily decline in values is important. (To be continued)
※2 Important: Trend 888; Foreign Investor Movement 2; Series 4
Today as well, we begin with the Dow RSI total. In the U.S. market that opened this morning, the Dow fell 313.98 dollars (1.18%), and the RSI total fell to 69.11% (out-of-speed-limit: 60%–80%). If the Dow rises by more than 90 dollars in tonight’s market, that value would exceed this morning’s reading, and while a bottom (confirmation) cannot be declared, this would be the first time the previous day’s figure is surpassed during this correction. If the close remains unchanged and the market continues as is, the bottoming date could be extended to next Tuesday.
However, if this is the bottoming time axis we expect, given that the value is approaching the lower bound of the out-of-speed-range, it should be seen as quite near.
And this time, while the value is unlikely to drop far below the out-of-speed range, reaching the “one-stop license level,” at present (as noted) the likelihood is low; if it occurs, it would likely be due to the breakdown of the U.S.–China ministerial trade talks scheduled to begin on the 10th in Japan time.
Regarding this, the previous evening, following upbeat remarks from Kudlow at the U.S. NEC, Chinese authorities also stated that "the U.S.-China agree on multiple points," which spread a sense of reassurance. Last night, however, the U.S. Commerce Department added 28 Chinese surveillance-camera manufacturers and public-security organizations to its "Entity List," casting doubt on the talks’ prospects and serving as a major drag on the stock market.
Was it Powell who was disappointed by this?
To curry favor with President Trump, he stated that "to curb rising short-term interest rates, further asset purchases are needed," and, as with the ECB’s recent stance, hinted at a quantitative easing-like policy. Yet the market reacted weakly, and it was reported that Trump even suggested visa restrictions for a Chinese official implicated in minority repression, which effectively signaled the end of the game. The stock market continued to fall, and as noted in MD, the VIX rose above 20 for only the second time since 8/28.
Apologies for the long preface, but the recent decline was caused not by foreign investors' physical selling but by futures selling. The key point is that the week of 9/27 was a dividend-taking week.
I have prepared a table showing foreign futures selling during the dividend-taking week, weekly Nikkei highs and lows, and the following five weeks’ foreign futures activity and the cumulative Nikkei upside-down moves over that period. It will be attached to Friday’s Trend (the Trend will be the only segment delivered that day due to system maintenance—sorry). For now, please look at the attached table showing foreign futures balance since the Abe-nomics era.
What I wrote yesterday about last October’s “Nikkei at its 27-year high” being driven by foreign futures buybacks as shown by the red arrow on the left remains the key supply-demand factor.
What happened is that, after a net selling of 3.7 trillion yen at the end of March, all of it was bought back within about six months.
And this time, after last year’s end there was a 5 trillion yen selloff; there was a temporary buyback, but after Golden Week it sold again, reaching a record net selling balance of 5.5 trillion yen on 8/16. In September this balance was bought back in one go, allowing the Nikkei Average to record the top September gain of 5.1%, but the far right bar in the bar chart shows the selling balance widening again.
This portion corresponds to the 353.5 billion yen of selling in September’s dividend-taking week. (to be continued)
Inoue Tetsuo’s Market Trend can be found here
Inoue Tetsuo “Market Trend”
Open an account and read two weeks for free! DMM Stock Account Opening Campaign
DMM Stocks × Inoue Tetsuo “Market Trend” Campaign


For individual stocks, Inoue Tetsuo’s B-Community “Winner Screening” is recommended!
DMM Stocks × Inoue Tetsuo B-Community “Hybrid Battle” Campaign