
NEM/XEMのピークは来週に来るような気配:暗号通貨チャートウォッチ2021 Translation: The peak of NEM/XEM seems likely to come next week: Crypto Chart Watch 2021
0
NEM/XEMI have been watching its current status.
I would like to observe and analyze its past price movements from technical analysis and consider future movements.
As the chart makes clear at a glance,the market has become quite heatedI think. On March 1st, it showed a daily rise of more than 10 yen for the first time in over three years (coincheck).
The snapshot of Symbol and launch schedule have finally been announced, and it was revealed that there are numerous partnerships lined up by that time and afterward, and a PR strategy using influencers and media has been scheduled.

In addition, a trading battle involving multiple overseas exchanges has begun, with total prizes around 53 million yen (actual start will be after guidance to users from each exchange).
In the trading battle, of course the first and second stages until launch will be XEM trading, but it has been announced that the third stage after launch will be XYM. That means several overseas exchanges are almost certain to list XYM soon after launch, right? haha
With that in mind, the snapshot on the 12th and the launch on the 15th are just around the corner, and the market is expected to heat up gradually, so let's keep a close watch.
The peak that will likely attract both attention and momentum will surely be the area highlighted in red in the image.
Now, let's check the chart situation.
This morning we broke through Resistance A, but this line is not highly important; it Nearifies an entry point for accumulation, and the line to emphasize isResistance B.
There is broad awareness that the moment of buying demand occurs at snap shots,In the remaining 10 days, breaking through Resistance B will be a major focal point, it seems.
In Japan88 yenhas started to be watched. This is the price at which, after the Coincheck theft incident and the suspension of trading, the weighted average price was 88.549 yen and refunds were issued.
It is likely to be a price level that will be watched to some extent, but it is quite possible that the general public has forgotten this price level, so it may be fine to treat it as a topic to be mindful of.
By the way, in USD it is around 0.86–0.94 dollars, in BTC around 8000–9000 satoshi, which were the actual prices on that day. Against BTC, the price turned out to be quite high, lol
Let's check the Numa Meter.
From the blue area (outer space) back into the atmosphere.In a strong trend, the pattern is to exit and re-enter this node, rising firmly from itHence, let's hope for another ascent, breakthrough of the atmosphere again, and aiming for space.
This is how you read the Numa Meter, so beginners can refer to it.
With the rise of cryptocurrencies, the barrier to trading is certainly lower (should be lowered), so to help broader audiences learn visually and more attractively, it is expressed like this, but basically it is stochastic.
To keep it going, interest and curiosity must stay high. For that, any reason will do.
Observing over a slow timeframe helps detect major trend turning points.
Since October 2016, the Swamp Observer has, known by those in the know, forecasted many major market moves.
That is all!
Below, technical settings are paid member information. Since the series ends on March 17, those who cannot start new subscriptions or continue will not be able to view them, but that should be fine, right! lol
I would like to observe and analyze its past price movements from technical analysis and consider future movements.
As the chart makes clear at a glance,the market has become quite heatedI think. On March 1st, it showed a daily rise of more than 10 yen for the first time in over three years (coincheck).
The snapshot of Symbol and launch schedule have finally been announced, and it was revealed that there are numerous partnerships lined up by that time and afterward, and a PR strategy using influencers and media has been scheduled.
In addition, a trading battle involving multiple overseas exchanges has begun, with total prizes around 53 million yen (actual start will be after guidance to users from each exchange).
In the trading battle, of course the first and second stages until launch will be XEM trading, but it has been announced that the third stage after launch will be XYM. That means several overseas exchanges are almost certain to list XYM soon after launch, right? haha
With that in mind, the snapshot on the 12th and the launch on the 15th are just around the corner, and the market is expected to heat up gradually, so let's keep a close watch.
The peak that will likely attract both attention and momentum will surely be the area highlighted in red in the image.
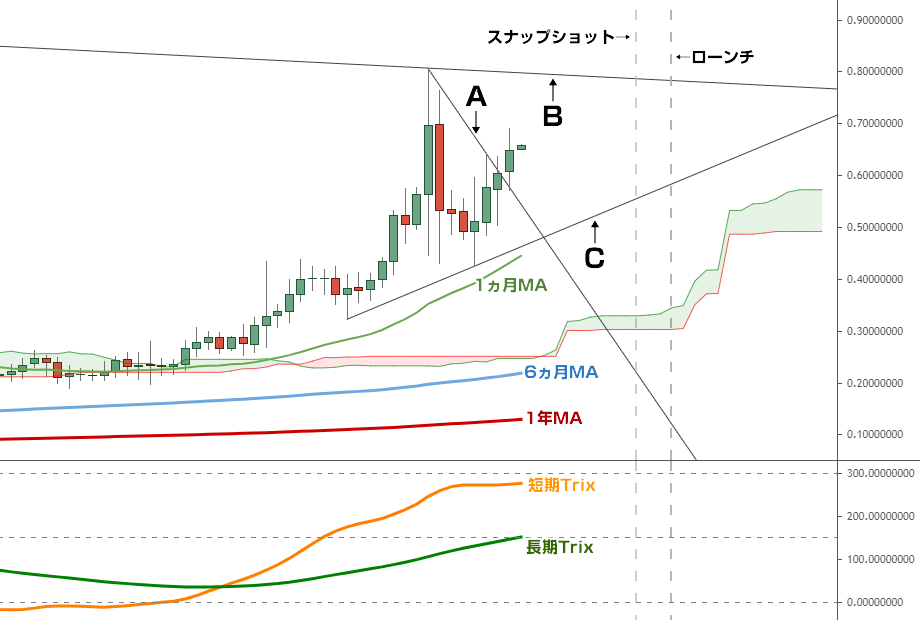
Now, let's check the chart situation.
XEMUSD/Poloniex
Resistance A: Feb 22, 2021 high → Feb 27, 2021 high
Resistance B: Jan 2018 high → Feb 2021 high
Support C: Feb 15, 2021 low → Feb 26, 2021 low
Everything is progressing smoothly.Resistance B: Jan 2018 high → Feb 2021 high
Support C: Feb 15, 2021 low → Feb 26, 2021 low
This morning we broke through Resistance A, but this line is not highly important; it Nearifies an entry point for accumulation, and the line to emphasize isResistance B.
There is broad awareness that the moment of buying demand occurs at snap shots,In the remaining 10 days, breaking through Resistance B will be a major focal point, it seems.
In Japan88 yenhas started to be watched. This is the price at which, after the Coincheck theft incident and the suspension of trading, the weighted average price was 88.549 yen and refunds were issued.
It is likely to be a price level that will be watched to some extent, but it is quite possible that the general public has forgotten this price level, so it may be fine to treat it as a topic to be mindful of.
By the way, in USD it is around 0.86–0.94 dollars, in BTC around 8000–9000 satoshi, which were the actual prices on that day. Against BTC, the price turned out to be quite high, lol
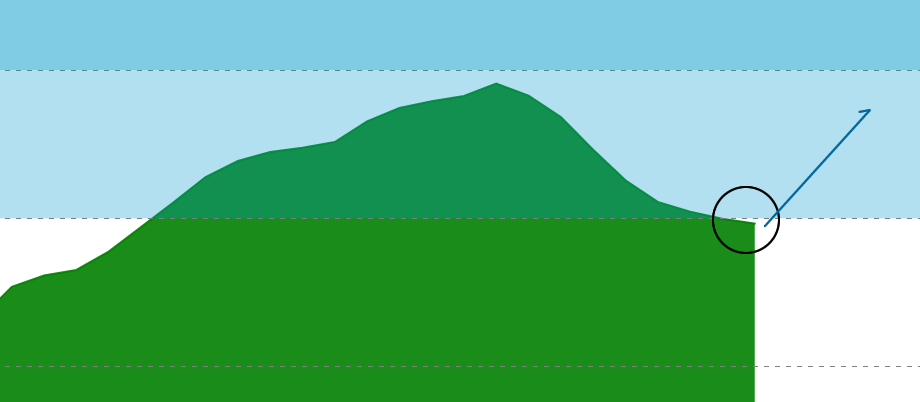
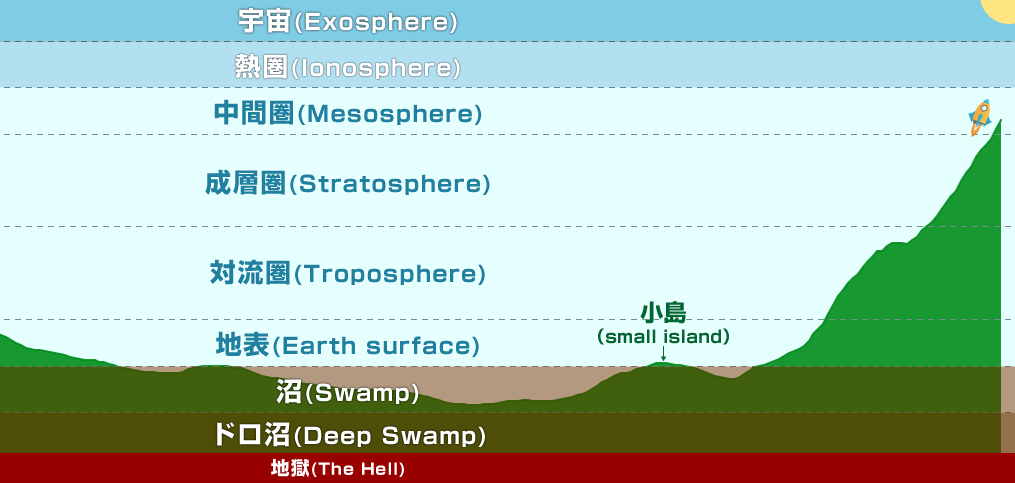
Let's check the Numa Meter.
From the blue area (outer space) back into the atmosphere.In a strong trend, the pattern is to exit and re-enter this node, rising firmly from itHence, let's hope for another ascent, breakthrough of the atmosphere again, and aiming for space.
This is how you read the Numa Meter, so beginners can refer to it.
With the rise of cryptocurrencies, the barrier to trading is certainly lower (should be lowered), so to help broader audiences learn visually and more attractively, it is expressed like this, but basically it is stochastic.
To keep it going, interest and curiosity must stay high. For that, any reason will do.
Observing over a slow timeframe helps detect major trend turning points.
Since October 2016, the Swamp Observer has, known by those in the know, forecasted many major market moves.
That is all!
Below, technical settings are paid member information. Since the series ends on March 17, those who cannot start new subscriptions or continue will not be able to view them, but that should be fine, right! lol
× ![]()