【Indicator Feature ③】Editors' picks! Recommendations! Indicator Collection

【Feature】One Step Ahead! How to Use Indicators
There are many popular indicators such as moving averages, MACD, stochastic, and RSI. But are you just displaying them on the screen and vaguely judging overbought or oversold?
Indicators are tools to measure the market. Therefore, when using indicators, you need to understand their characteristics well and adjust them to fit your trading. In this feature, we’re doing a deep dive from how to use popular indicators, how to set them up, and even which combinations work well together—advanced techniques for leveraging indicators!
【Feature Page】Table of Contents
・① Step beyond default settings to improve win rate!
・② Usable! Top 5 Best-Selling Indicator Rankings
・③ Editor's Picks! Recommended Indicator Collection ←This article is here
・④ Traders’ Tips! Techniques for Combining Indicators
・⑤ Introduction to Popular Custom Indicators
※This article is a reprint and editing of FX攻略.com April 2021 issue. Please note that the market information stated in the text may differ from the current market.
Here we introduce carefully selected, recommended indicators by our editorial team. Use this as a reference and give them a try.
Moving Average Deviation
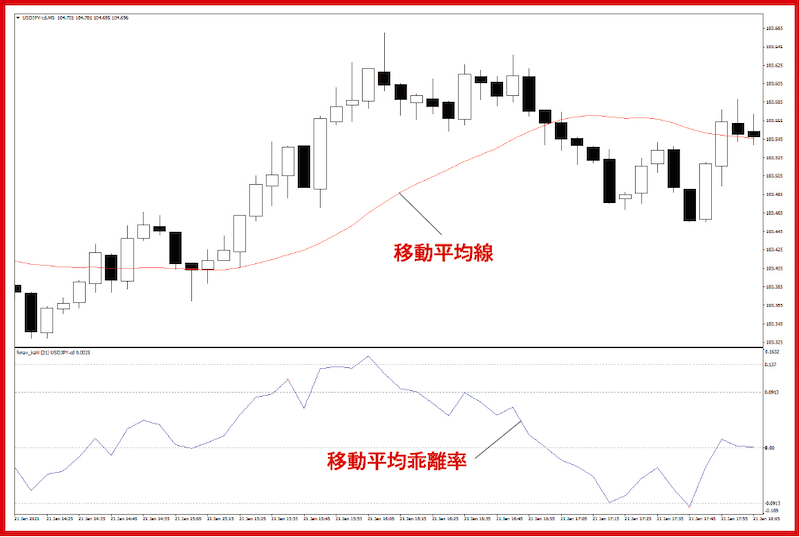
Quantifying the distance between price and moving average!
Moving average deviation is an oscillator-type indicator that numericizes how far the price deviates from the moving average, letting you gauge market temperature such as overbought or oversold.
This indicator is based on the rule that price movements will eventually converge toward the moving average. If the price remains far from the moving average and does not converge, you can interpret that as temporary overbought or oversold conditions in the market.
Relying on eyeballing deviation can delay detecting trend reversals caused by rapid price moves, but by quantifying deviation you can improve trading decision accuracy.
Calculation Formula for Daily Time Frame

To quantify the degree of separation from the moving average, subtract the moving average value from the day's closing price and then divide by the moving average value. If price is equal to the moving average, it is 0%. When price is above the moving average, it is called “positive deviation”; when below, “negative deviation.”
Basic Interpretation and Use
Generally, when price strongly deviates above the moving average and the deviation becomes highly positive, that is considered overbought and a sell signal; conversely, when price deviates strongly below the moving average and the deviation becomes highly negative, that is oversold and a buy signal. If in the past the deviation reached high positive or negative values, those values can be reference points. For example, if historically it moved up to +/-5%, then a rise to +5% may be viewed as selling pressure, while a drop to -5% may be viewed as buying pressure. It’s good to pay attention to the most recent range of fluctuation.