USDJPY was supported by the monthly cloud and finished June.[2017-07-01]
Blog "Watching and freely applying will turn the market into the splinter of a hatchet"転載しています。
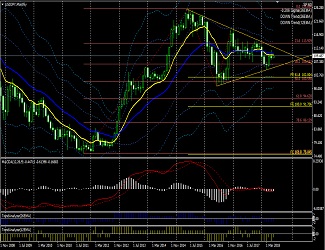
July 1, 2017 Dollar/Yen Monthly Chart
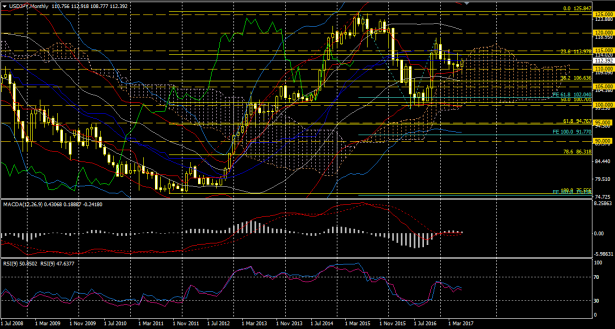
The June opening price started inside the cloud, but the closing price moved above the cloud, and in relation to the candlesticks the uptrend continued. Will July recover to 115 yen?
The lagging span is turning bearish, and overall it is in a corrective phase.
Judging from MACD, RSI, and Bollinger Bands, the market is nearly neutral, able to move up or down.
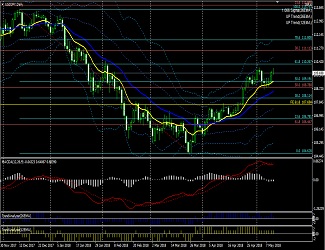
July 1, 2017 Dollar/Yen Weekly Chart
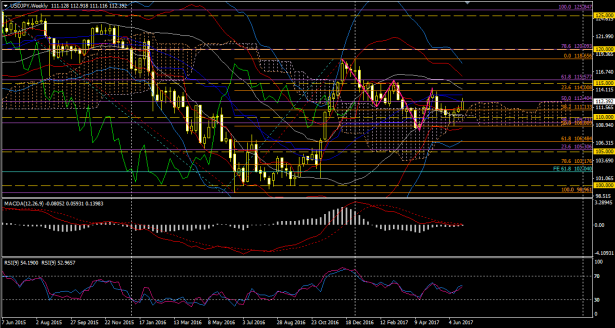
On the weekly chart, the cloud supports the candlesticks and the uptrend continues.
However, the lagging span is bearish, and overall it is in a corrective phase the same as the monthly chart.
Even looking at MACD, RSI, and Bollinger Bands, the market is nearly neutral, able to move up or down.
In terms of wave analysis, since the lows are rising, after an abc corrective wave, the first and second waves of the directional wave may be completed, entering the third wave; there is a possibility of forming a complex wave (abcxabc), and in either case, no clear prediction can be made.
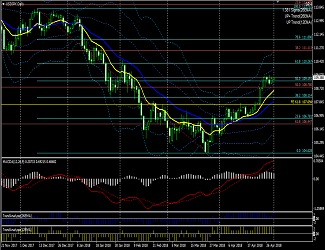
July 1, 2017 Dollar/Yen Daily Chart
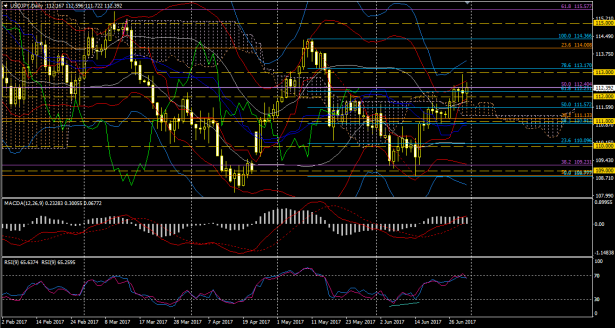
The Ichimoku Kinko Hyo on the daily chart shows a bullish three-line improvement.
However, in terms of chart patterns, a pennant is forming with lower highs and higher lows, and if the decline is seen as Wave 1, it may be time for Wave 5 to turn around. RSI has risen toward 70, supporting this. The Fibonacci retracement suggests a potential move to 78.6%, so the current up-swing could extend a bit further. If so, the target would be in the mid-113s. Yet, since there is also a possibility that the directional wave on the weekly chart is progressing, it is not possible to state a single definite high target.
↓ MACD used in the above chart.