

N wave pullback buy example with video!
Hello!
I am Satori, researching Binary and FX.
Today, I will guide an example signal of the 0.382 reversal of the N-wave.
The figure below shows an example of a 0.382 pullback buy signal within an upward move on the AUD/JPY 15-minute chart.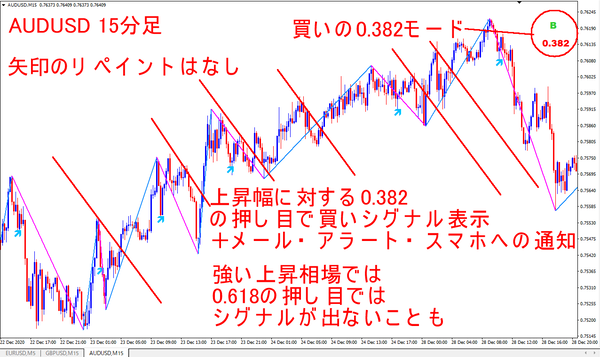
https://livedoor.blogimg.jp/fxmt4indicator/imgs/2/1/21df609f.png
In the above chart, a buy signal appears at the 0.382 pullback against the upward move, but
there is almost no signal when the pullback is at 0.618.
This is because in a strong uptrend, pullbacks are shallow.
When using the 0.618 reversal signal, the uptrend should be near a boxy/sideways move.
Also, in the above figure, a counter-trend line that intersects perpendicularly to the direction of progress is drawn,
and adjusting the entry timing using this counter-trend line also seems to be effective.
The indicators used today are as follows.
Non-repainting N-wave 618 reversal pullback buy indicator
https://www.gogojungle.co.jp/tools/indicators/27490
This is introduced in a YouTube video.
https://youtu.be/0H597fBA3Fw
Thank you very much for reading up to here today as well.
Email: info-at-mark-canary2.net
※Register for the “FX Wave Riding” free newsletter
https://1lejend.com/stepmail/kd.php?no=UbHSvri


