

Last week's scalping trend analysis
Hello!
This is Satori, researching FX.
It's gotten hot, but today it's a bit cooler, so I'm relieved.
Last week I performed a one-hour chart analysis of USD/JPY using a gap-trading method.
Last week, after a sharp 150-pip drop at the start of the week, a W-bottom formed in the middle, it paused, and then climbed back about 150 pips toward the end of the week.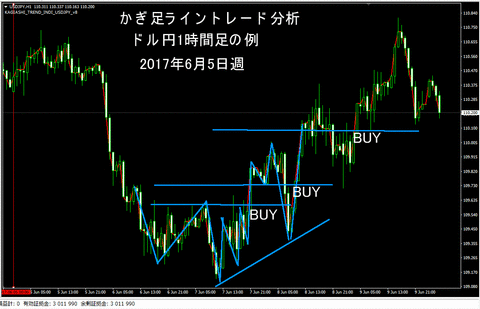
There were three buying opportunities.
The first was when the head of the W-shaped bottom broke through the top of the W.
The second was after breaking the bottom of the W and then pulling back to switch direction.
IncidentallyKey Foot Trend Indicator Swing signals, emails, and alerts also trigger when breaking the previous high, or when switching from the lower price area.
The third was after breaking through further and pulling back to switch direction.
Here too, the Gartley/Gann-inspired 45-degree line is visible in the market.
Even if the angle seems to be about 60 degrees during a sharp rise, it typically corrects and rises from a lower price, settling around a roughly 45-degree angle.
In any era, the psychology of sellers and buyers remains basically the same.
From the May 31 article on the "Dow Theory Applied Filter," you can download for free as much of the GIF images used in the blog, MT4 test reports, etc., as possible.
This time as well includes images.
Blog images and MT4 report free download
http://fxmt4indicator.abproducts.biz/files/FXnoShirabe.zip
The password is posted as a four-digit number in the introduction comment section on the linked page under “Technical Trade Blog Ranking.”
Thanks to you, we are currently ranked 11th.
Technical Trade Blog Ranking
※ On the pages below you can view a catalog including free products.
http://fxmt4indicator.abproducts.biz/wp/


