Dollar-Yen: Is the adjustment rally on the 4-hour chart finished? [2017-06-10]
Blog「When you watch and freely stretch, the market will become a magic hammer\" is reprinted from this.
We are approaching France's parliamentary elections. In the last presidential election there was a big window. This time?
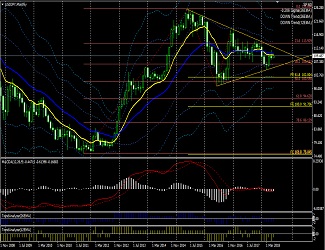
June 10, 2017 USD/JPY 4-hour chart
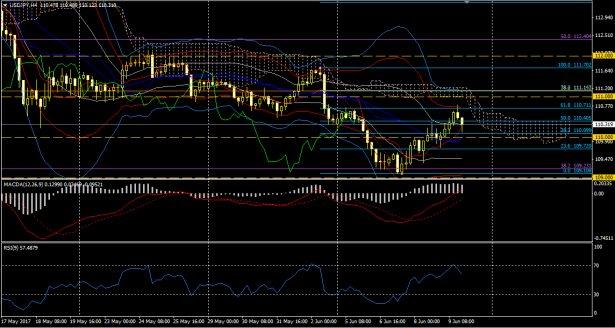
Last week, in the middle of the week, it bounced just before 109 yen and formed an upward swing. The swing contains fine internal swings and can be said to be an upward adjustment.
Currently, the lagging span has hit the real body of the candle, reached Fibonacci retracement 61.8%, and the Bollinger Band has reached +2σ, RSI has reached 70, so it is reasonable to think we are near the end of the upward swing.
However, in relation to the cloud and the candles, there is still room for upside.
The Bollinger Band is facing horizontally, giving the impression of the start of a range.
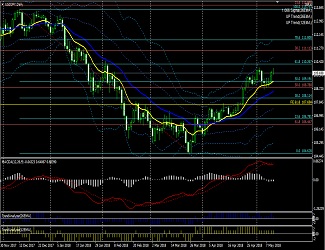
June 10, 2017 USD/JPY Daily
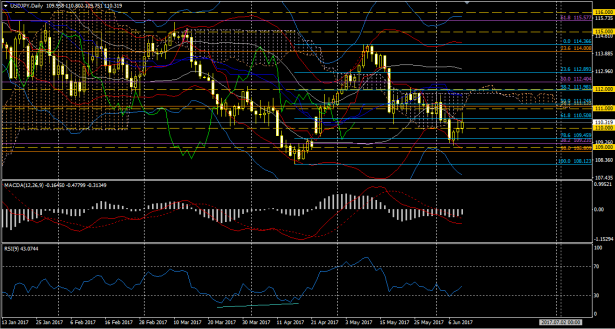
On the daily chart, the downward swing around 114.3 is still continuing (RSI has shown a rebound after hitting 30, but the down swing cannot be said to have ended). It retraced to the 78.6% Fibonacci retracement from the previous up swing and filled the gap created on April 24. At this point, there is a possibility that the downward swing will extend to 100% retracement, or the price could switch to an upward swing and move into a sideways market.
The lagging span is turning negative, the price is on the negative side of the Bollinger Band, indicating medium-term downward momentum.
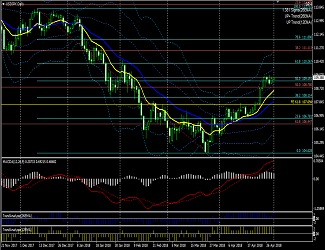
June 10, 2017 USD/JPY Weekly
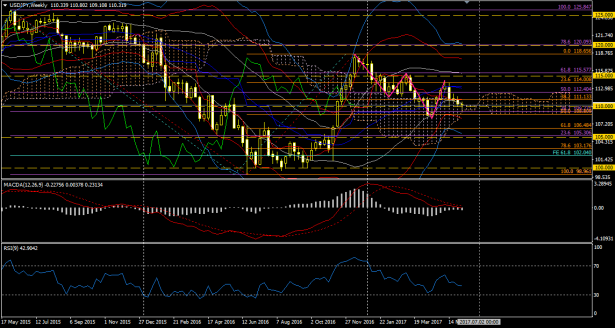
This week's weekly candle has a longer lower wick with a small real body, showing a slow decline.
The pink wave could be wave 5, or a first wave of an ABC wave plus directional wave. If candlesticks do not break below the cloud in the future, the latter becomes more likely.
We should judge later by watching the 4-hour and daily movements as well.
↓MACD used in the above charts.