Dollar/Yen Weekly and Daily Ichimoku Lagging Span Bearish Crossover, Will Yen Appreciate? [2017-06-03]
Blog “When you view and freely draw, the market becomes a hit-or-miss tool” is quoted.
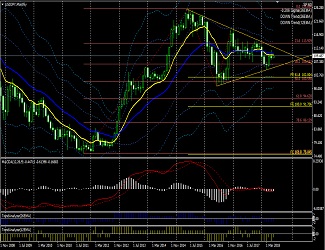
June 3, 2017 Dollar/Yen Monthly
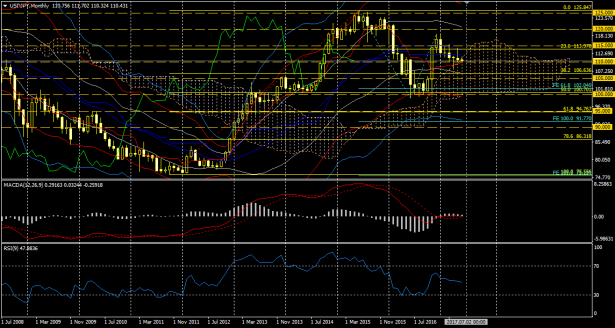
May's candlestick is a bearish candle with a long upper shadow. Since June, the candlestick has been inside the cloud. The lagging span is in negative territory. Since the start of the year, it has been trading on the negative side of the Bollinger Bands. A correction phase continues after the rally following the US presidential election. Another 2–3 months of correction may be necessary.
MACD and RSI show no directional bias.
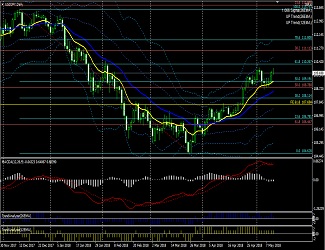
June 3, 2017 Dollar/Yen Weekly
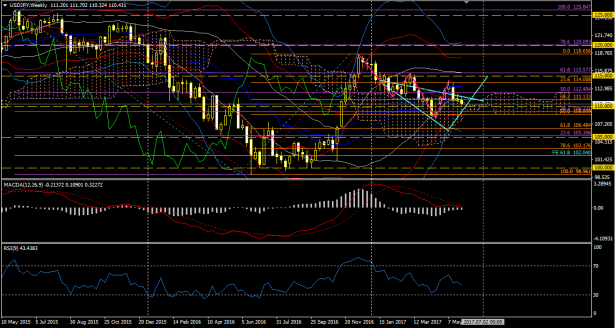
This week's candlestick shape is weak. The lagging span is negative. The cloud's edge is turning positive. At present, from the monthly to the 30-minute chart, the lagging span is negative while the cloud edge is positive. In short, there is no clear direction. This is reflected in the weekly Bollinger Band. On the weekly chart, this month is entering a thin-cloud period. A triple-top reversal is a likely scenario. The previously noted expanding triangle (pink waves) seems to be forming the fifth wave. The target value is the orange Fibonacci retracement 61.8%. It is currently near 110 yen, but it remains to be seen whether it will break below 110 yen.
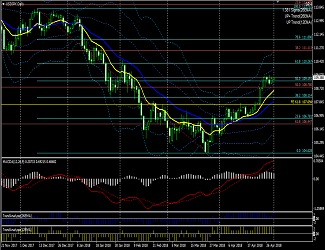
2017年6月3日 ドル円 日足
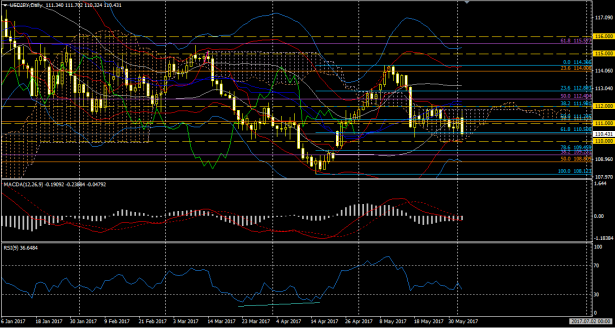
Last night's employment data pushed it down and closed near the low. The daily chart's lagging span has turned negative. The alignment of the negative timing on the weekly and daily charts suggests the market may be entering a changing phase. If the candlestick on the daily chart also breaks below the cloud, it would complete the triple-top reversal, likely aligning with the weekly chart. If that happens, this month may see further yen appreciation.
On the daily chart, Bollinger Bands, MACD, and RSI all show downward pressures. Currently near the lower end of the range.
↓ MACD used in the above chart.