

Cryptocurrency Market Analysis [November 16 Issue]
Bitcoin rose further from 1.6 million yen last week and reached 1.7 million yen
and set a new record.
Bitcoin daily chart
In the daily chart,
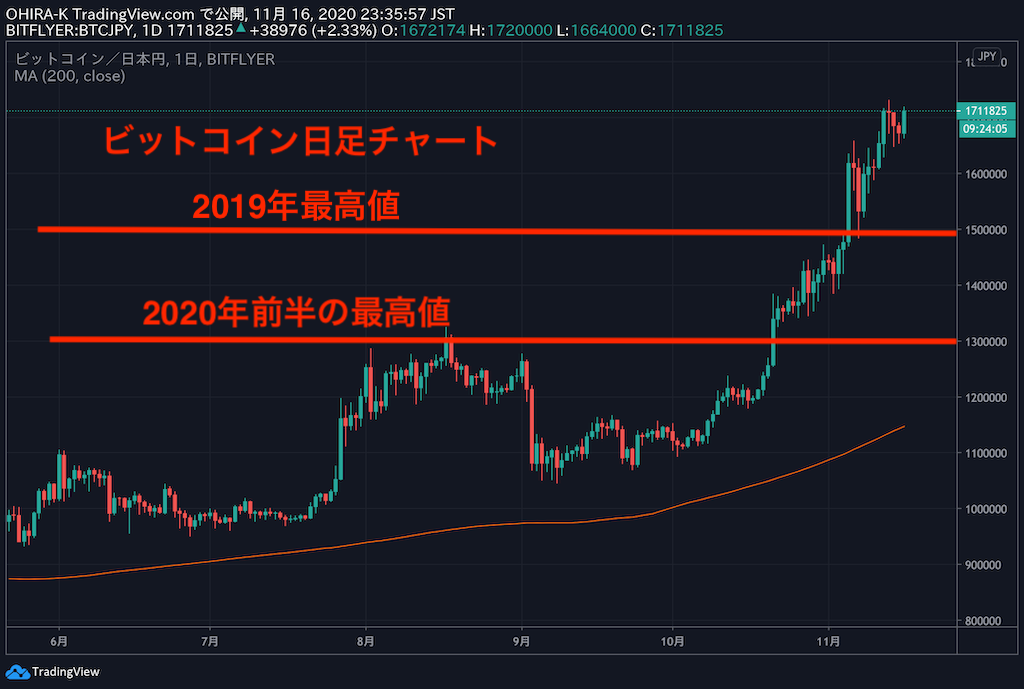
two red horizontal lines
・ the highest price in early 2020
・ the highest price in 2019
these two lines
formed a single resistance line
but they were broken, and from the 2019 high of 1.5 million yen
to 1.6 million yen was reached at once.
Looking at Bitcoin’s price last week on the daily chart,
・ bullish candles: 4
・ bearish candles: 3
(each candle represents one day)
There aren’t consecutive bullish candles,
but because bullish candles are large (price rise),
the price has risen from 1.6 million to 1.7 million yen.
Once it reaches this price range,
the bubble levels since late 2017 become a price range to compare with.
Bitcoin weekly chart
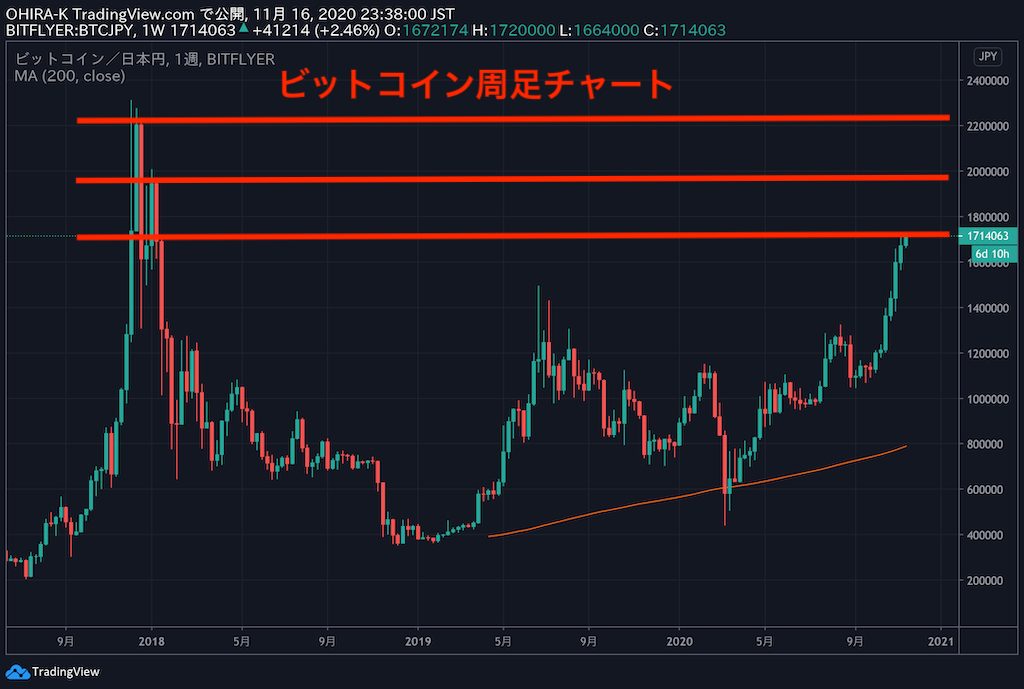
On the weekly chart,
compared with the late 2017 bubble,
Bitcoin has reached a single price point.
At this stage, there may be people who are selling Bitcoin.
What is notable in Bitcoin prices is the milestone
2,000,000 yen.
There are more individual investors who expect to reach it by year-end.
and they are increasing.
【What’s different between the bubble period and now?】
An analysis of the differences between the bubble period and current Bitcoin
will be presented.
Regarding fundamentals,
as I’ve mentioned before,
・ Bitcoin’s presence as a digital gold
・ Increased risks of fiat currency inflation (triggered by COVID-19)
・ Large companies purchasing Bitcoin
and these very strong fundamentals exist.
Also in chart analysis,
・ Despite the rise, volume relative to price
rises are low (stable)
which is a major characteristic
to note.
During the bubble, Bitcoin’s volume (transaction value)
was large, but even more so the price surged.
Mata
In 2019 and 2020,
Bitcoin’s volume has continually
increased compared to before.
However, relative to volume,
the rise is still lower than in the bubble.
Bubble-era volume: 570 billion yen
Current volume: 2 trillion 600 billion yen
and4 times higher, yet
the current 1.7 million yen has not reached
the bubble’s peak price of 2.2 million yen.
Volume is displayed as a bar graph at the bottom of the chart.
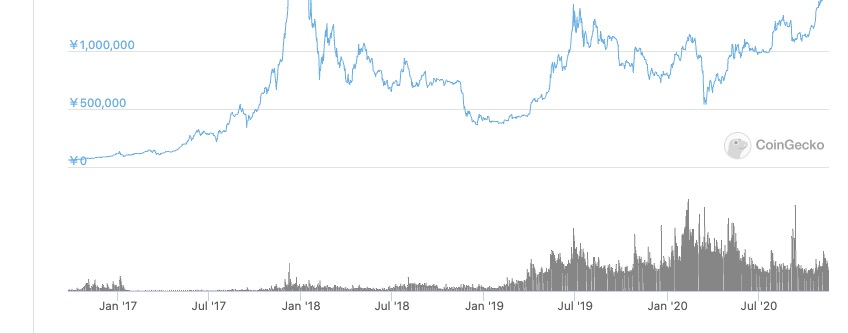
In other words, it cannot be called a bubble yet
in this price range.
It indicates that a growing portion of Bitcoin holders
is buying for the medium to long term.
Also, the number of active wallets and
the actual number of wallets trading Bitcoin
is increasing,
suggesting more people are holding Bitcoin.
This trend is very favorable and indicates a
price stability for Bitcoin.
【Looking back at the bubble period】
During the bubble, Saif’sCM (Ayame Goryo)
Coincheck’sCM (Tetsuro Degawa)
increased public interest,
and TV news frequently covered Bitcoin.
In Tokyo, there was a Nem Bar,
which operated from late 2017 to January 2018,
and on weekends in January 2018 there were lines for entry.
Details about Nem Bar (now closed)
https://bitcoin-newstart.com/nember-shibuya1210
Also, globally renowned investor
Warren Buffett
stated to the media that
“it is a clear bubble.”
Taking all of the above into account,
currently
・ not much attention from the public
・ not making the news
・ few statements from famous investors
compared to the bubble period, it remains
in a normal state.
However, what is supporting this price rise
is corporate Bitcoin purchases.
)