What does the 4-hour adjustment for USD/JPY expanding to the daily level mean... [2017-05-28]
Blog "Watching and freely drawing makes the market a wand of success" - Reprinted from the above.
May 28, 2017, USD/JPY, Monthly
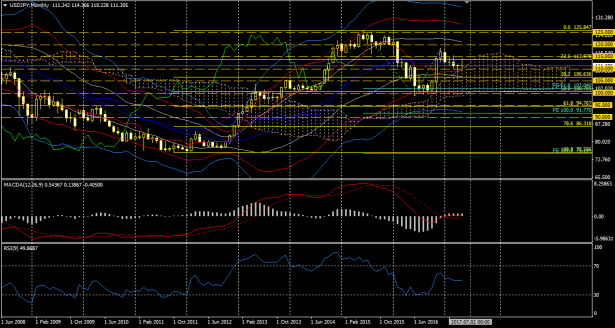
May is almost over. The monthly chart shows an uptrend. The cloud provides support for the candlesticks. The leading span 2 is rising and the cloud top is in positive territory. However, the lagging span is negative, indicating a medium-term range market. Bollinger Bands, MACD, and RSI also indicate a range market.
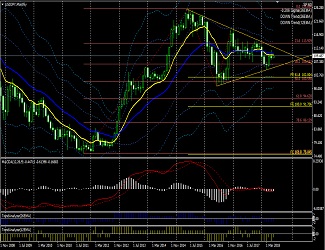
May 28, 2017, USD/JPY, Weekly
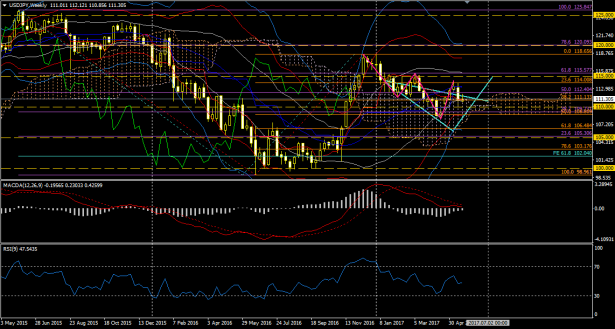
The weekly bollinger band has contracted fully. When the next move happens, it is expected to be a move of considerable magnitude. In the short term, a range around the upper cloud boundary (111.3) is central, and the current rate is near its center.
Continue to watch the pink-marked waves. Also, since the weekly cloud turning point is approaching, this should be monitored.
The lagging span is touching the body of the candle. Will it turn negative?
On the weekly chart, I think we are approaching the final phase of a corrective move after the presidential election. There could be a drop to retest the 61.8% orange Fibonacci retracement.
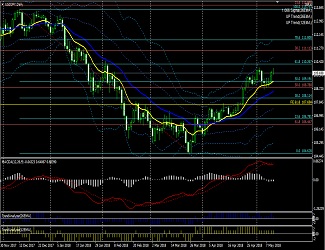
May 28, 2017, USD/JPY, Daily
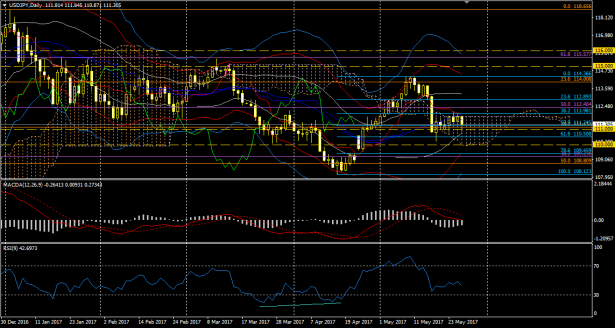
Last weekend, the fifth wave of the Elliott wave direction on the 4-hour chart was in progress and expected to move lower, but the lagging span on the daily chart was hindered by the real body, making it difficult to set a new intraday low. However, the actual market has been moving sideways to buy time, increasing the likelihood that the lagging span will turn negative. Currently, the candlesticks are being held by the upper edge of the cloud, and if the market continues to move sideways this week and the lagging span turns negative, there will be little resistance on the daily chart to the downside, making a new low (below 108) more likely.
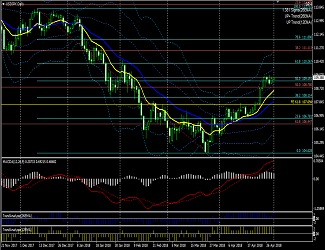
May 28, 2017, USD/JPY, 4-hour
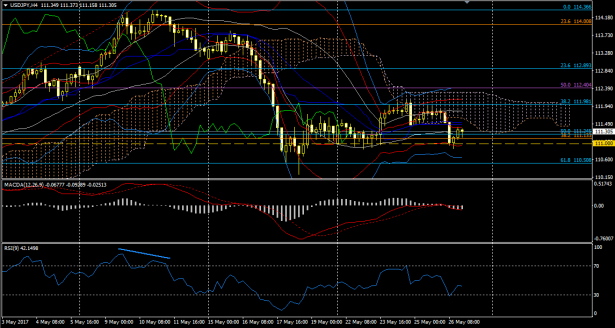
In the 4-hour chart, the lagging span is entangled with the real body, resulting in a chop near the lows. Going forward, the leading span 2 of the cloud's edge will continue to decline, syncing with the daily lagging span turning negative, and the decline may resume. Recently, a large bearish candle has been followed by a slow rise for a retracement, indicating the downtrend is strengthening again.
↓ MACD used in the above chart.


MACD with alerts + Bollinger Band extension + Trend Analyzer + Pivot
MACD (4 alert types, email capable) trading system