Dollar/Yen - Elliott Wave directional motion is in progress on the 4-hour chart [2017-05-20]
Blog "When you watch and apply leverage, the market becomes a Lucky Charm of trading" quoted from.
May 20, 2017 — USD/JPY — 4-hour chart
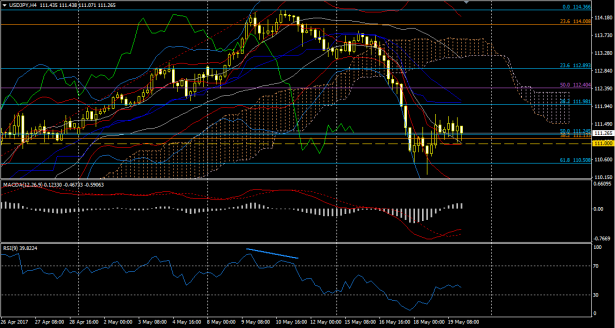
On the 4-hour chart, after RSI divergence formed last week, the direction of the Elliott wave is moving forward. It is currently considered to be the 4th wave. However, there is a small RSI divergence at the low, suggesting that the 5th wave may end here and the current movement could be a corrective wave.
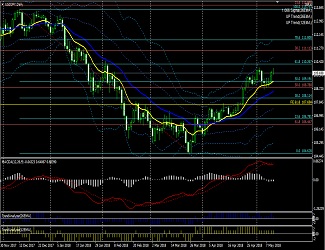
May 20, 2017 — USD/JPY — daily chart
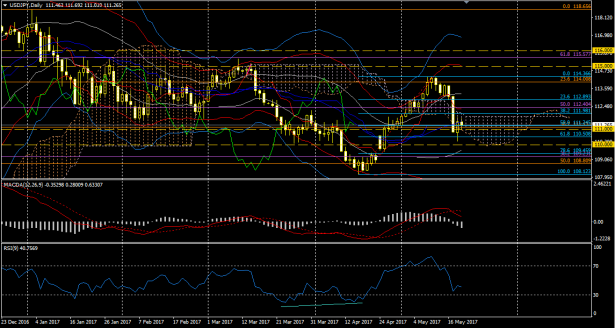
On the daily chart, the decline has been stronger than expected. Downward pressure seems likely to continue for a while. The market may aim to fill the gap created on April 24. Currently, the 61.8% Fibonacci retracement level is being watched as the retracement stage.
Until a strong RSI divergence appears on the 4-hour chart, the decline seems likely to continue. The target at that time would be the 78.6% Fibonacci retracement. The lagging span has turned positive, so for prices to fall further, additional factors such as further dollar weakness or yen strength would be required.
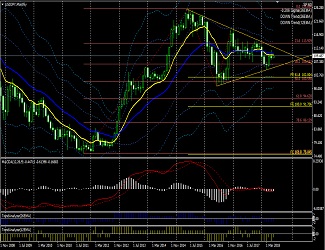
May 20, 2017 — USD/JPY — weekly chart
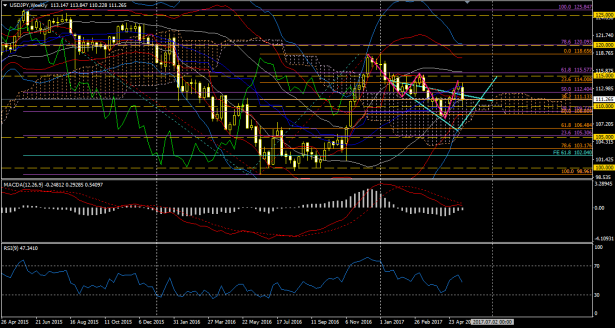
On the weekly chart, the market has again moved close to the upper boundary of the cloud. In the future, there is some possibility of a move toward the 61.8% Fibonacci retracement, and whether the pink-colored wave becomes an expanding triangle of Wave 5 is a possibility to consider.
The lagging span has hit the real body of the candlestick. Will it turn bearish or follow the candlestick movement? The MACD line could also turn negative. Various technicals are delicate.
↓ MACD used in the chart above.


MACD alerts + Bollinger Band expansion version + Trend Analyzer + Pivot
MACD (4 alert types, email-capable) trading system