USD/JPY daily up swing may have ended for now. [2017-05-13]
Blog "Watching and freely applying to the market will make it a hammer of opportunity" is excerpted.
May 13, 2017 - USD/JPY daily chart
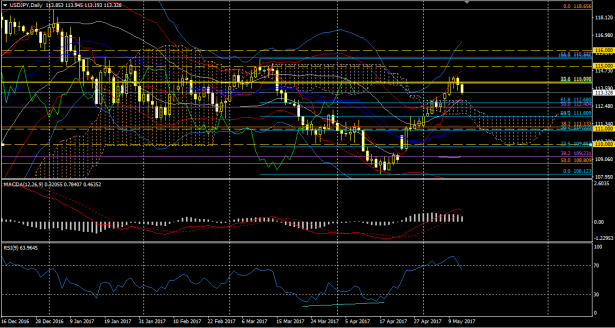
Last week's close, I thought we would enter a pullback around 113 yen, but it was only a small consolidation, and ultimately it rose to around 114.3.
When looking at the market in relation to the Daily Pivot and the 1-hour Bollinger Bands, the 11th Thursday can be read as a turning date and the 12th as a downtrend. Also, the Ichimoku Kinko Hyo on the 1-hour chart shows a triple cross reversal in progress from the middle of the 12th. From these points, the daily chart’s upside swing is considered to have ended for now. Whether this move is a retracement or a reversal is not clear at this time.
There is no RSI divergence, so the MACD may continue to decline while the market rebounds and perhaps forms divergence.
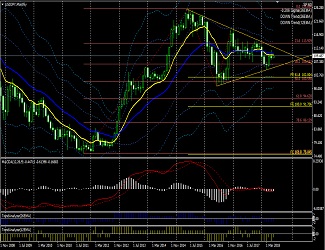
May 13, 2017 - USD/JPY weekly chart
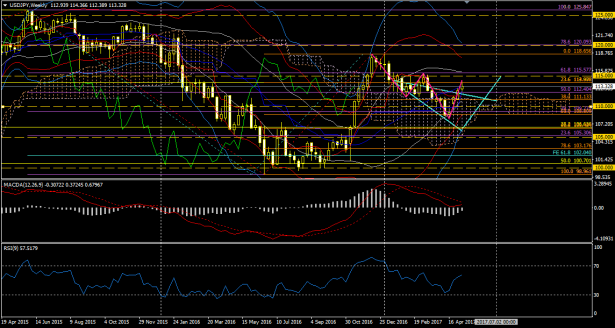
On the weekly chart, the technical situation has not changed much from last week.
However, we should note that this week's candle has a long upper wick.
The pink drawn wave that has long drawn attention to me still appears to be a five-wave expanding triangle. If that is the case, the fourth wave has ended, and the next fifth wave would be a fairly large decline swing (roughly 8 yen in range). It is not expected that a vertical drop will begin immediately, but near the end of the decline swing there may be quite rough movement.
Technicals tend to lead fundamentals, so for a while going forward I think attention will focus on factors that strengthen the yen or weaken the dollar.
↓ The MACD used in the above charts.


With MACD alerts + Bollinger Band expansion + Trend Analyzer + Pivot
MACD (four alert types, email capable) trading system