Geniusly original, prodigiously inventive, unconventional indicator aiming to hit the ceiling and the floor
Many indicators have, essentially, a formula or method of calculation.
※ Excluding time-based indicators and other special cases
Most are calculated from numbers, but
sometimes they are not about numbers, but about what follows from what, in terms of calculations.
Anyway, they still make judgments based on the price action up to that point.
Indicators developed by traders and analysts around the world over many years of trial and error,
have been developed from a wide range of ideas as those ideas nearly exhausted their supply.
Among them, quite special, or
highly original indicators are
TD Sequential (TD Sequential)
was developed by a person named Tom DeMark
who is widely known as a world-leading figure in chart analysis.
Tom DeMark developed technical systems and indicators and studied market timing analysis throughout his life.
His masterpiece is said to be the TD Sequential
.
For details about the person and TD Sequential’s mechanism, if you are interested, please look it up yourself.
Very briefly, the way to read and use it is as follows:
When conditions align from price movement, it starts counting from “1.”
“9” and “13” are the limits or the maximum,
and in any case they indicate the peak
“9” (or around “8”)
or
“13”
Please look at the corresponding number.
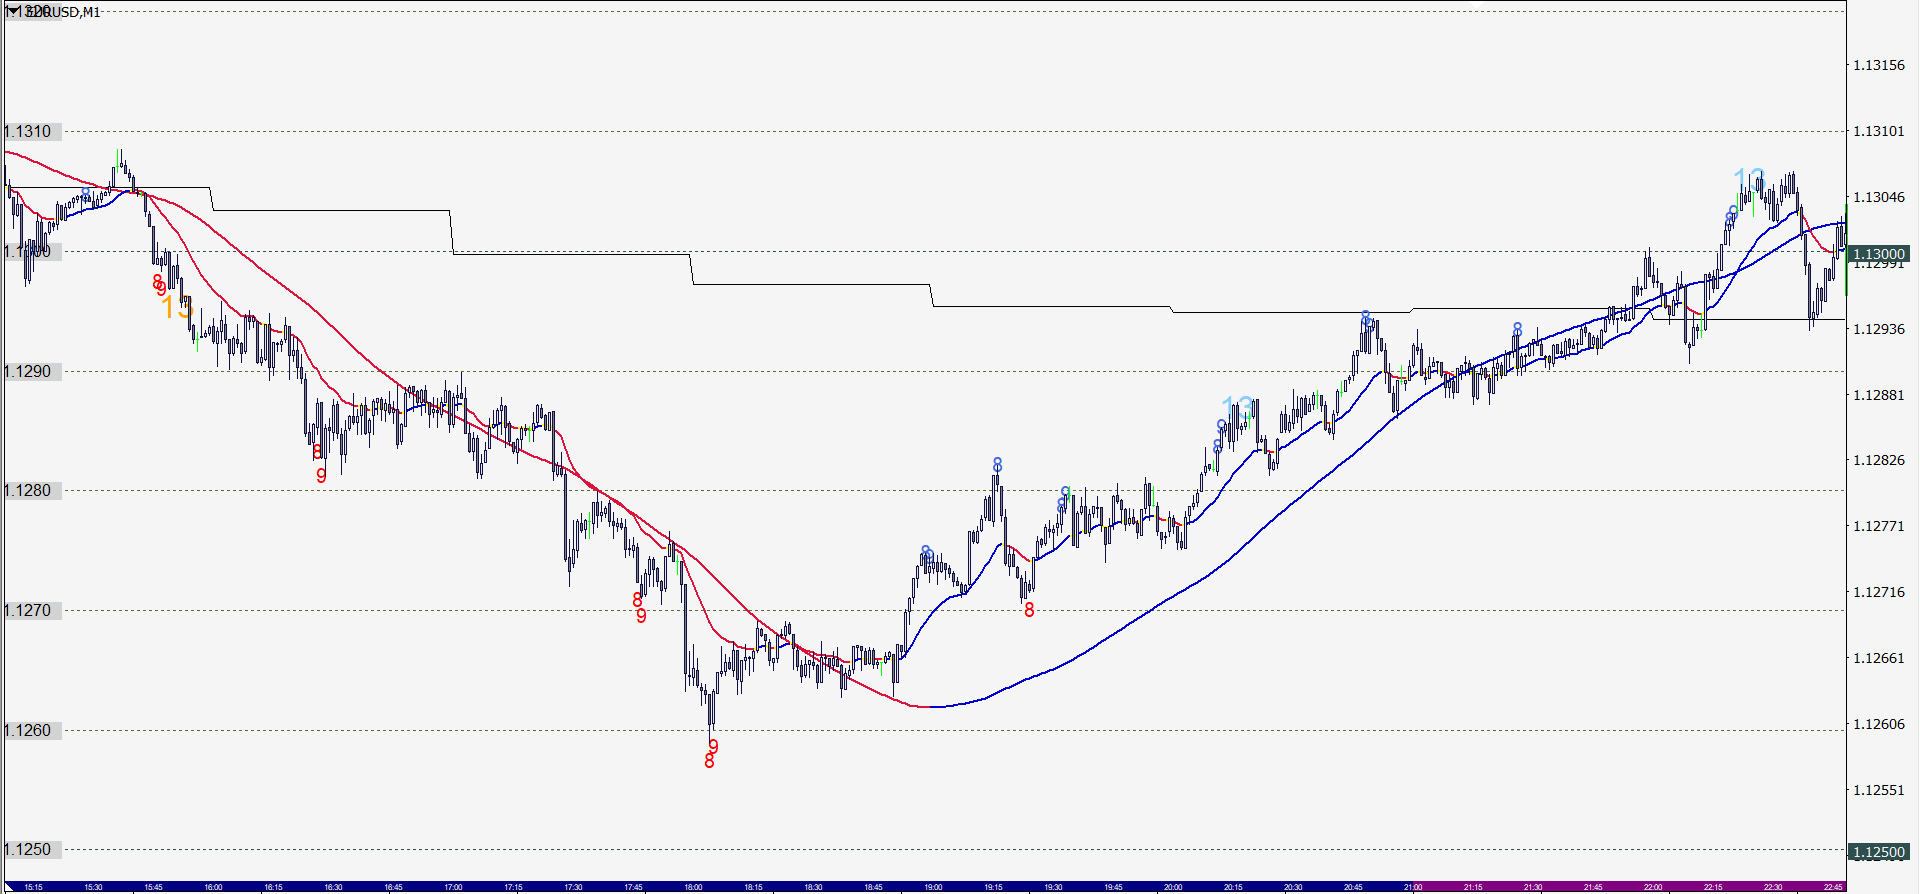
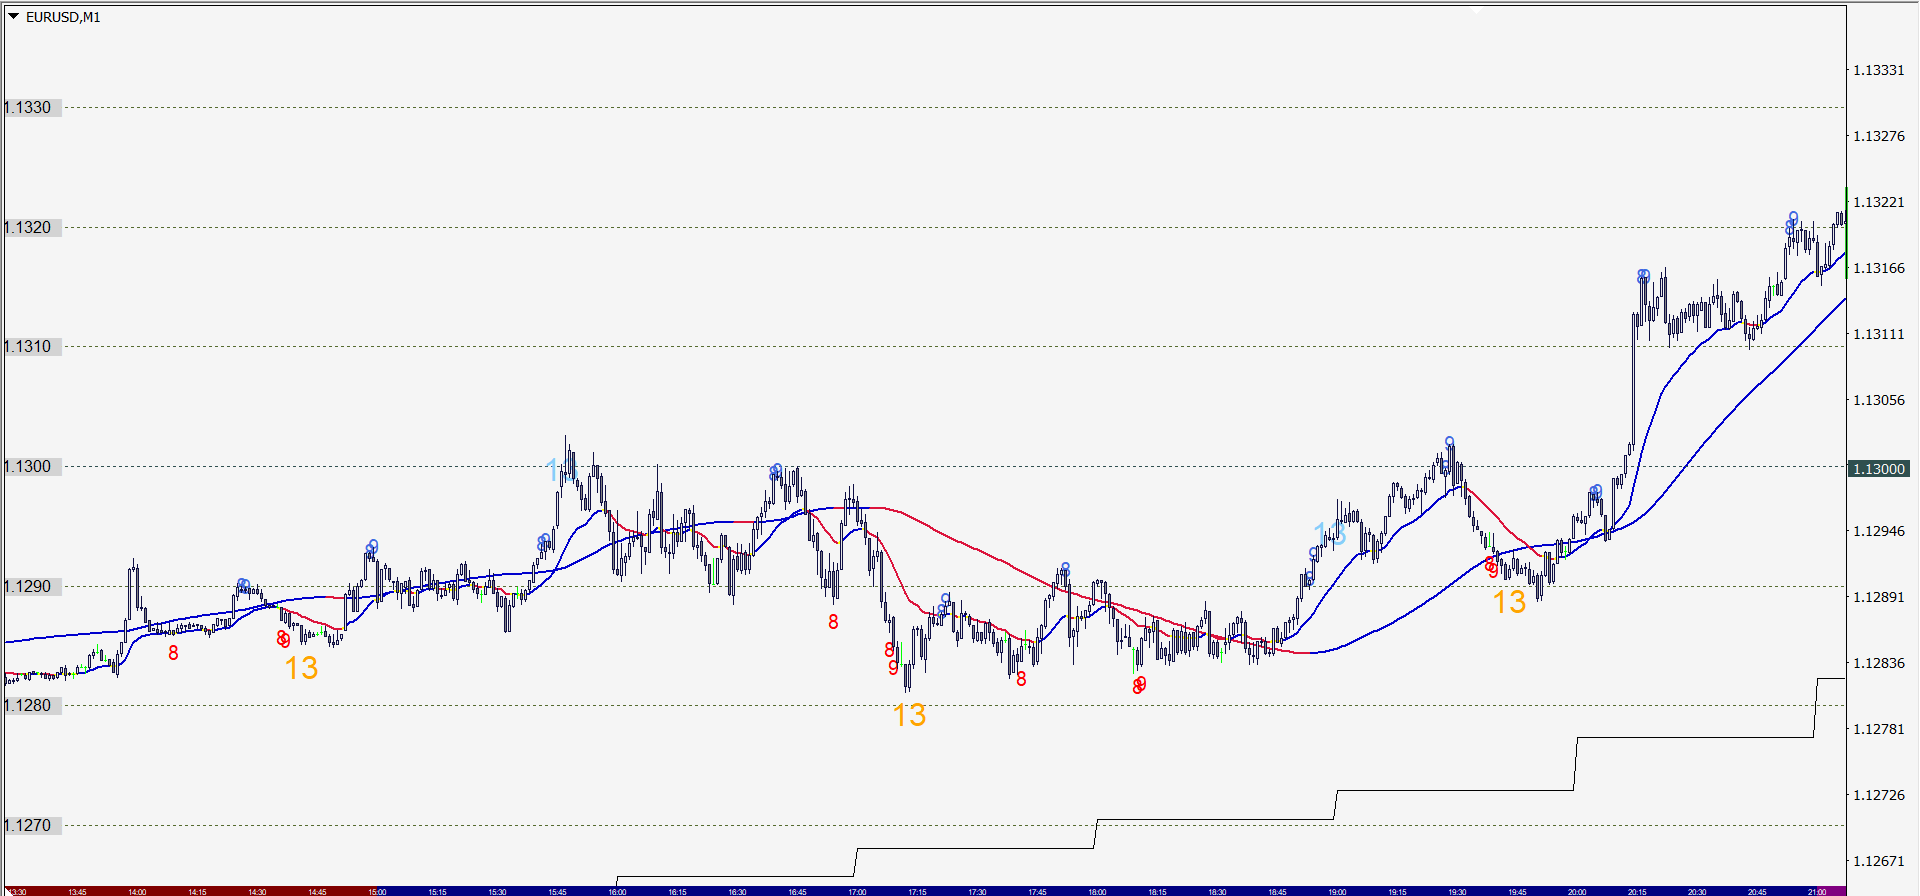
You can see that it’s displayed quite close to the top or bottom.
That said, of course, it is not perfect, and not absolute.
There are quite a few caveats...
However, we have used various indicators, and
this one is quite amazing...
It might be good to use as a basis for taking profits.
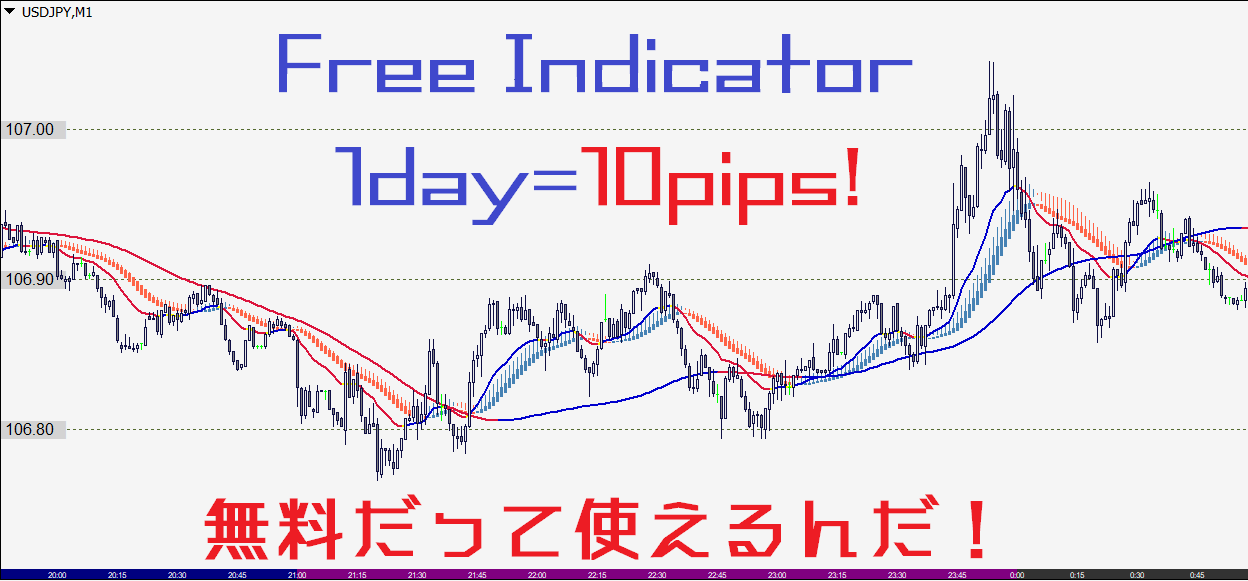
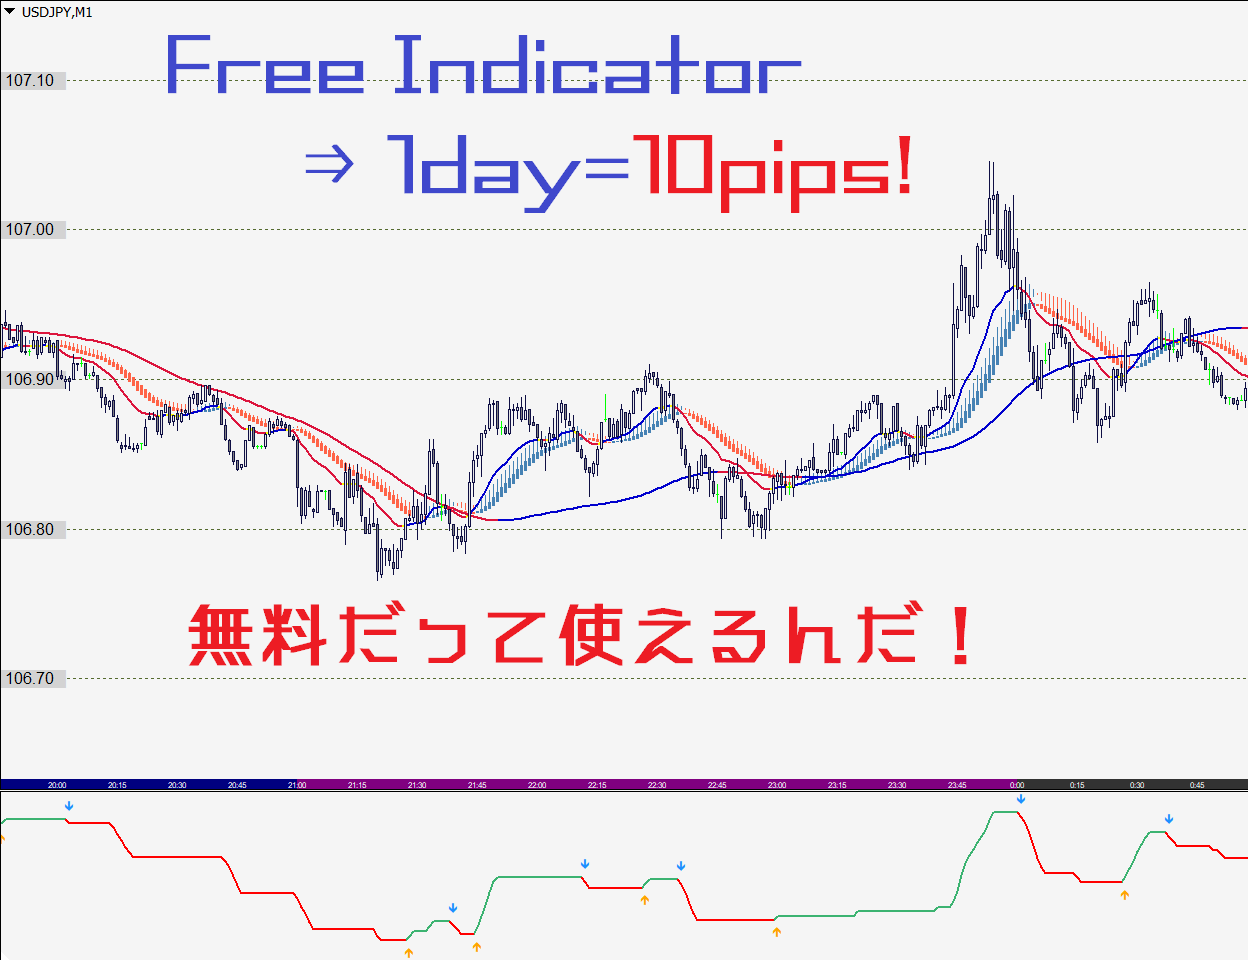
In our EHMtrade method,
in the plan to capture a total of 10 pips,
I think it would pair quite well.
In fact, considering implementing it,
we customized it to output only the necessary numbers and began testing.
It’s a indicator we knew about for a long time,
but it isn’t indispensable,
whether it’s easier to trade with it or
whether it is better to do without it, it’s a matter to test
.
Below, very briefly,
I’ll outline the counting logic
【TD Setup】
Where a new trend begins
Detect where corrections occur within the current trend
Price reversals cause a price flip
Conditions for a price flip to occur
■ Downward → Upward
The last close is higher than the close four bars ago, and the previous close is lower than the close five bars ago.
■ Upward → Downward
The last close is lower than the close four bars ago, and the previous close is higher than the close five bars ago.
When these conditions align, counting from “1” begins
If the trend continues, it continues counting, and
if the count stops before reaching “9,” then counting starts again from “1.”
Counts continue from 9, then 10, 11, 12, 13, 14… until a price flip occurs.
【TD Countdown】
Calculates the length of the trend
Moment of trend termination
Detects the appearance of price-variation elements of a new cycle
When the setup count that continued beyond 9 ends, it moves to the countdown phase
Countdown conditions
■ When it is rising
The last close is lower than or equal to the close two bars ago.
■ When it is falling
The last close is higher than or equal to the close two bars ago.
Unlike the setup, the countdown does not need to be consecutive, so skipping one or two candles still satisfies the condition and counts forward.
Another final condition
■ Indication of an upside reversal
The low of the 13th candle is lower than the close of the 8th candle.
■ Indication of a downside reversal
The high of the 13th candle is higher than the close of the 8th candle.
When all these conditions are met, the “13” lights up. (If publishing to buyers, please rewrite this part.)