Chart Analysis Spotlight 8: Learn Pivot Usage from YEN Kura-san
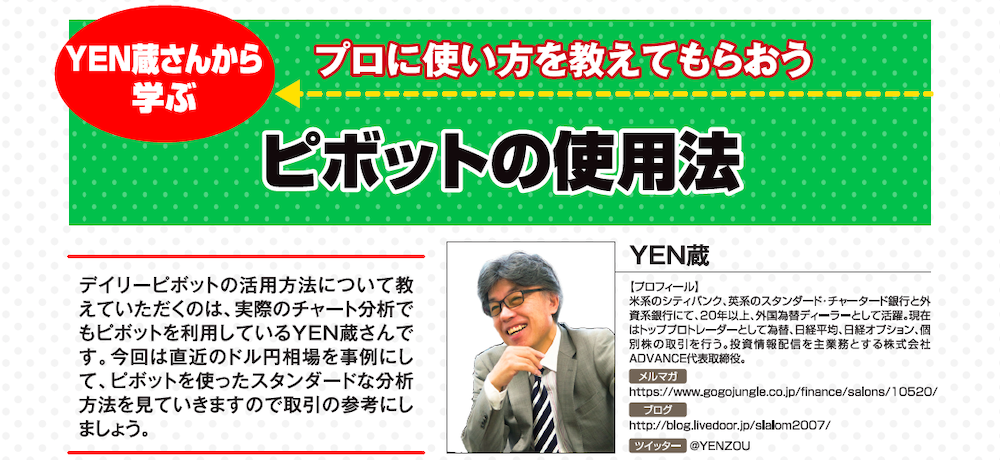
We’ll teach you how to use the daily pivot, and this time YEN-kuzou, who actually uses pivots in chart analysis, will show a standard method of pivot-based analysis using the most recent USD/JPY market as an example, so use it as trading reference.
YEN-kuzou Profile
He has worked for more than 20 years as a foreign exchange dealer at U.S. Citibank, U.K. Standard Chartered Bank, and other foreign banks. Currently, as a top professional trader, he trades currencies, the Nikkei 225, Nikkei options, and individual stocks. He is the representative director of ADVANCE Co., Ltd., which mainly distributes investment information.
Newsletter:https://www.gogojungle.co.jp/finance/salons/10520/
Blog:http://blog.livedoor.jp/slalom2007/
Twitter:https://twitter.com/YENZOU
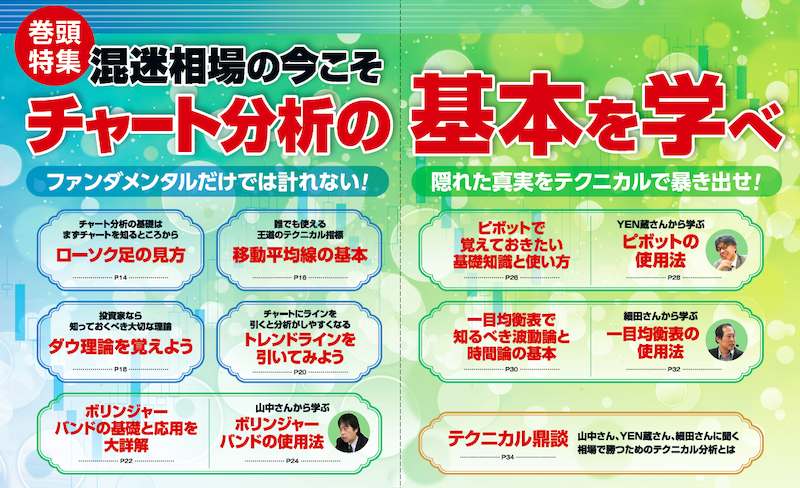
【Feature】 Learn the basics of chart analysis now in a volatile market
① How to read candlesticks — The basics of chart analysis start with understanding the chart
② Basics of moving averages — The classic technical indicator that anyone can use
③ Remember Dow Theory — An important theory every investor should know
④ Try drawing trendlines — Drawing lines on the chart makes analysis easier
⑤ Basis and practical use of Bollinger Bands explained in detail
⑥ Learn from Mr. Yamanaka about how to use Bollinger Bands
⑦ Basic knowledge and usage of pivots to remember
⑧ Learn pivot usage from YEN-kuzou
⑨ Wave theory and time theory you should know with Ichimoku Kinko Hyo
⑩ Learn Ichimoku Kinko Hyo usage from Mr. Hosoda
<Technical Roundtable> The three giants YAMANAKA, YEN-zou, and Hosoda speak to their hearts’ content
※ This article is a reprint and revised edition of an article from FX攻略.com, September 2020 issue. Please note that the market information stated in the text may differ from the current market.