[Chart Analysis Feature ①] How to Read Candlestick Charts: The Basics of Chart Analysis Start by Getting to Know the Chart
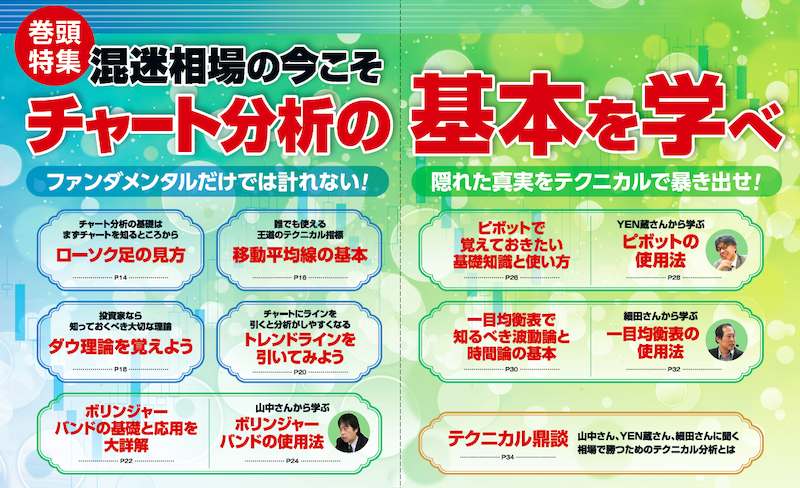
【Feature】 Now is the time to learn the basics of chart analysis in a chaotic market
① How to read candlesticks: The basics of chart analysis start with understanding the chart
② Basics of moving averages: A canonical technical indicator that anyone can use
③ Learn Dow Theory: An important theory every investor should know
④ Try drawing trend lines: Drawing lines on the chart makes analysis easier
⑤ In-depth explanation of the basics and applications of Bollinger Bands
⑥ Learn from Mr. Yamanaka about how to use Bollinger Bands
⑦ Fundamental knowledge and usage of pivots
⑧ Learn pivot usage from Mr. YEN-kura
⑨ Basic of wave theory and time theory as known through the Ichimoku Kinko Hyo
⑩ Learn Ichimoku Kinko Hyo usage from Mr. Hosoda
<Technical Roundtable> The three giants Yamanaka, YEN-kura, and Hosoda speak at length
※ This article is a reprint and edited version of an article from FX攻略.com September 2020 issue. Please note that the market information described in the text may differ from the current market.