

Cryptocurrency Market Analysis [July 14 Issue]
Bitcoin has been moving in almost the same price range as last week, around 970,000 yen.
In the past few weeks, 1,000,000 yen has remained in sight,
without any major fluctuations,
and it has traded in a range-bound market.
Bitcoin four-hour chart
Looking at the four-hour chart, it has been oscillating
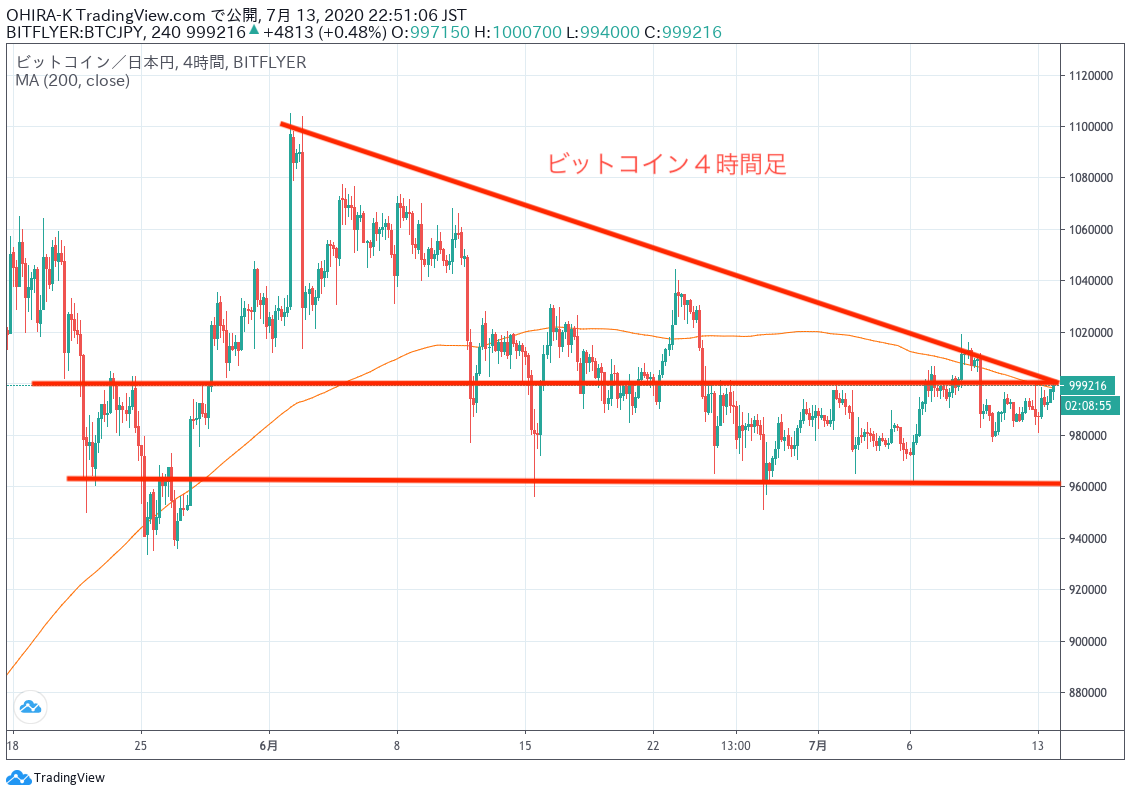
between 960,000 and 1,000,000 yen in a range-bound market.
It’s in a situation where it goes up and down within that range.
That area is the same as last week.
Bitcoin daily chart
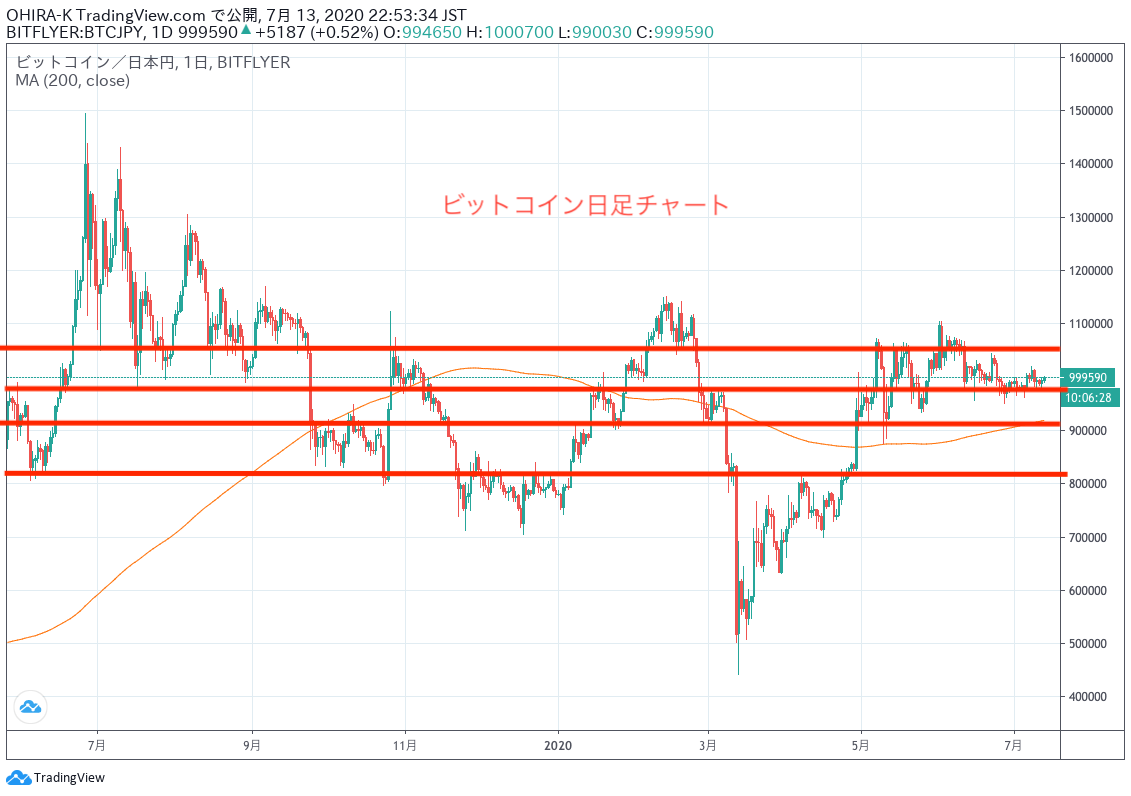
Despite being in the same price range as last week,
prices have become more converged and volatility has decreased.
【Buy signal for Bitcoin】
A buy signal has lit up on the Bitcoin hash ribbon.
Hash refers to mining difficulty,
and it indicates how much mining is being conducted in Bitcoin transactions.
In May, Bitcoin’s halving occurred,
and the rewards from mining were halved,
which temporarily reduced Bitcoin mining,
but mining later rose,
and the ribbon reflecting that rose on the chart became a buy signal.
Here is that chart.
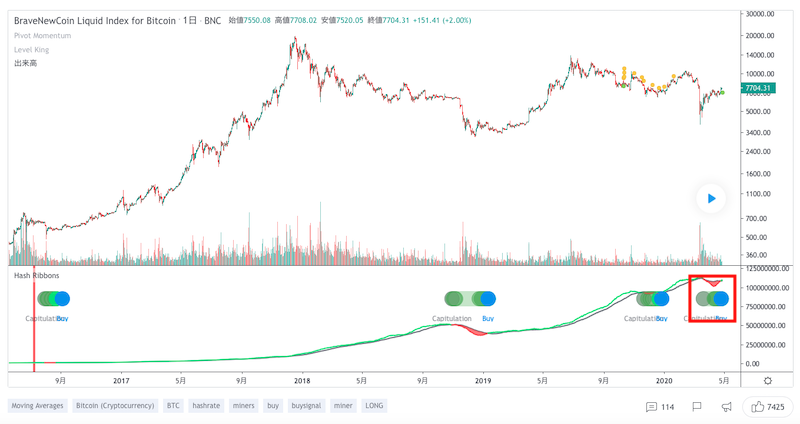
Buy signal on the hash ribbon
On the bottom of the chart,
you can see
1) August 2017
2) December 2018
3) December 2019
Among these,
1 and 2 have clearly functioned as buy signals.
This time, after Bitcoin’s halving, demand for mining has increased further,
making it a buy signal,
and the industry views it as a positive development.
For Bitcoin,
an increase in mining participation is positive.
Hash Ribbon official chart
https://jp.tradingview.com/script/kT7jIvqv-Hash-Ribbons/
Explanation about Bitcoin’s halving
is here
https://bitcoin-newstart.com/hangenki
【Altcoins are rising】
Last week, altcoins rose significantly.
Market-wide cryptocurrency share by currency.
That is, when the whole market is set to 100,
this shows what share of the market each currency occupies.
Here is that chart.
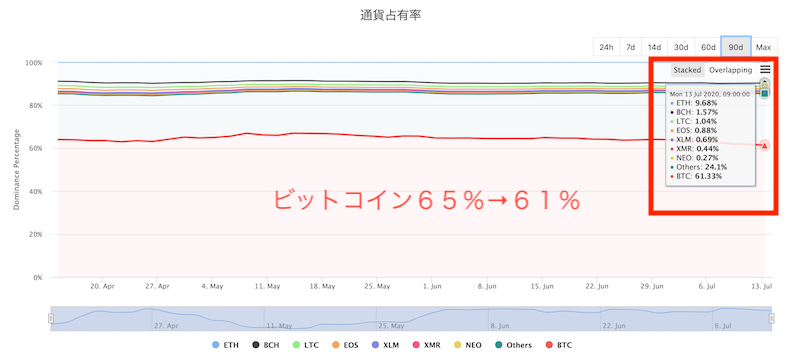
Compared to a few months ago,
Bitcoin’s share dropped from 65% to 61%,
and the share of altcoins increased, contributing to price rises.
The rise in altcoin dominance is due to the increase in the share of currencies other than the individual coins shown on the chart,
others.
Most likely, notable gains recently have been led by Cardano
and other coins with rising dominance.
The currencies I’m watching for ascent in this past week include:
・Chainlink 62%
・Dogecoin 41%
・Stellar 41%
・Atom (Cosmos) 37%
・Algorand 34%
Among these,
(private)
is
my invested currency.
Dogecoin
is the coin with the Shiba Inu icon,
and it is especially popular overseas and is similar to MonaCoin in Japan.
Elon Musk, the CEO of Tesla,
knows Dogecoin,
and it was a topic on Twitter before,
where it was said that Dogecoin has a CEO,
which became a topic earlier on Twitter.
But personally I think it’s all a joke.
Dogecoin’s practicality is not particularly high; it’s more about humor and the perception around it as an asset.
However, because it has high recognition, it can rise sharply in times like these,
but the downside is also large when it falls.
【Potential IPO on Coinbase】Coinbase, the largest exchange in the United States,
is rumored to consider going public.
This would be very positive for the cryptocurrency market, and
if realized, could lead to a significant inflow of funds into the entire crypto market.
【Cardano rises】
Cardano rose sharply from around 8 yen at the end of June
to briefly hit a high of 14 yen.
Cardano chart (four-hour chart)
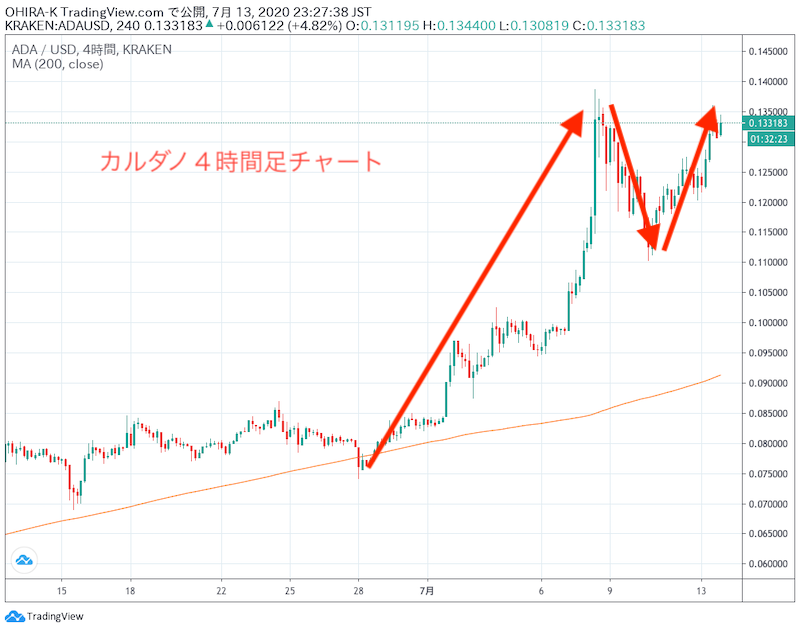
Cardano hit over 14 yen on July 9
and then temporarily declined.
(likely take-profit selling)
From there, it rose further to 14 yen again,
showing a fairly solid upward movement.
Factors behind Cardano’s rise
)