Dollar-Yen has reached an important point on the daily chart [2017-05-07]
Blog "Watching and freely applying to spread the market becomes the fusing pot of fortune" is reprinted from there.
Soon, the decisive vote for the French presidential election will begin. Depending on the result, will the market become volatile?
May 7, 2017, USD/JPY daily chart
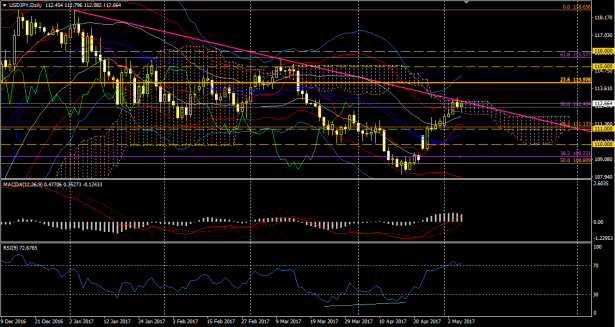
After hitting 113 yen on Thursday, it seems to be moving sideways in the high-112s.
The current point is constrained by the upper bound of the Ichimoku cloud and the trendline.
The lagging span is in an upturn, and considering that RSI is above 70, assuming a continued rise, there could be a sideways or trendline-following pullback, with a scenario heading toward 114 yen. Whether the pullback will be shallow and brief, or will take some time to pull back to around 111 yen, are the two patterns to consider.
Fibonacci retracement has not been drawn, but the current point corresponds to 61.8% of the March high to April low.
Also, the current point may actually be a reversal point, and a decline swing could begin.
May 7, 2017, USD/JPY weekly chart
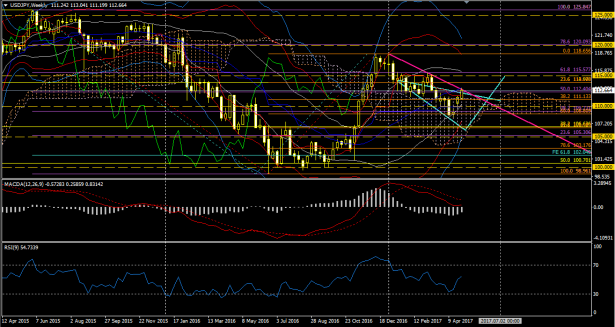
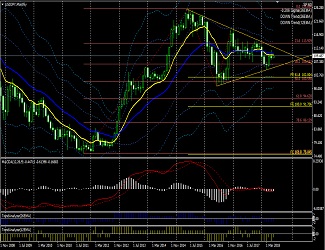
What stands out on the weekly chart is the contraction of the Bollinger Bands. It seems like the contraction may complete in another 2-3 weeks. The next move appears to be approaching.
Also, the MACD line starting to move sideways just above zero is noticeable. Could this also reflect an imminent move?
Ichimoku has returned to a three-line bullish turn. Therefore, it does not mean it will rise immediately.
The lagging span beginning to synchronize a little away from the real body is also concerning.
There are several concerning technical indicators like this, but there does not seem to be an immediate decisive statement to make.
↓ MACD used in the above chart.


MACD alerts + Bollinger Band expansion version + Trend Analyzer + Pivot
MACD (4 alert types + email) trading system