
[Free 공개] Swamp Observation Unit chases NEM/XEM deep in the jungle!
0

※This article is freely available only here!
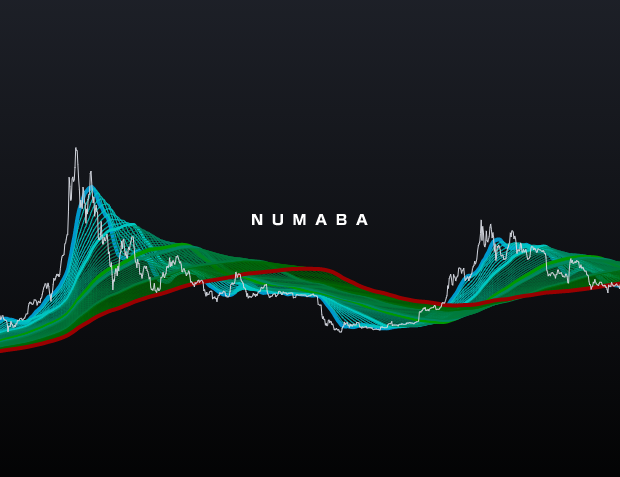
Numometerseems to be trying to signal something on the XEM chart, so I watched it a bit more closely.
Numometer has long been used to observe price fluctuations and trend reversals over extended periods. It captured signs of the 2017 crypto bubble as well.
Is it perhaps trying to convey a message to humanity about cryptocurrencies this time as well?
We headed into the jungle’s depths to unravel the mystery.
XEMUSD/POLONIEX
First, take a look at this. It shows the overall XEM chart. Since Numometer is drawn from the past year of data, there is nothing for the first year.
What I want you to focus on this time is the red circle. In simple terms, it signals, “It might jump from here soon.”
By the way, the first red circle is the earliest signal before the 2017 bubble, but Numometer’s future jump amount is unknown. For example, at points 1, 2, and 3, Numometer’s green rises up into the cyan area, but the price rise at 1, 2, and 3 is not the same.
Please remember that Numometer indicated areas like this previously.
Now, let’s take a closer look at the red circle area. In Numometer’s history, this is the fourth signal to appear.
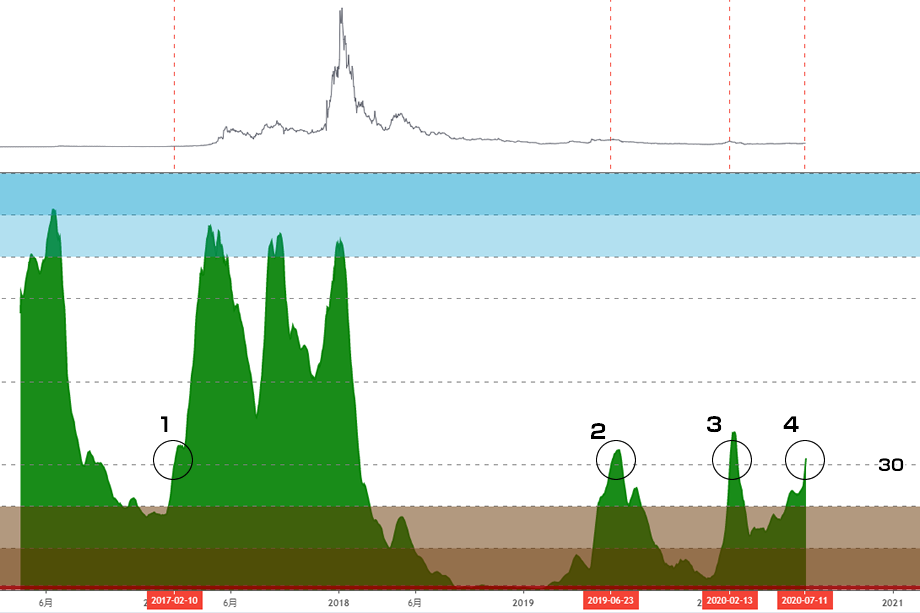
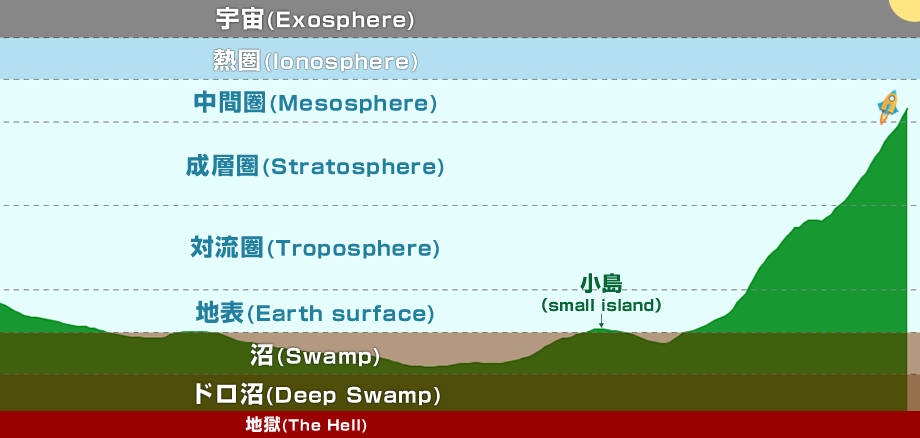
What’s common across 1–4 is that first it comes up from the swamp to the surface, and then the Numometer rises to the 30 line—the stratosphere. The real upper atmosphere has jet streams, so if Numometer breaks through the stratosphere, there’s an expectation that the price will leap “into space”… something like that.
The moment 1 (February 2017) showed its power most clearly, and I think no further explanation is needed.
The issue lies in 2 (June 2019) and 3 (February 2020): after escaping the swamp, prices rose, but neither broke through the troposphere into space and both stalled back into the swamp.
And now, about 4 (July 2020): its state differs clearly from 2 and 3. I ran my usual 1-year MA and 6-month MA.
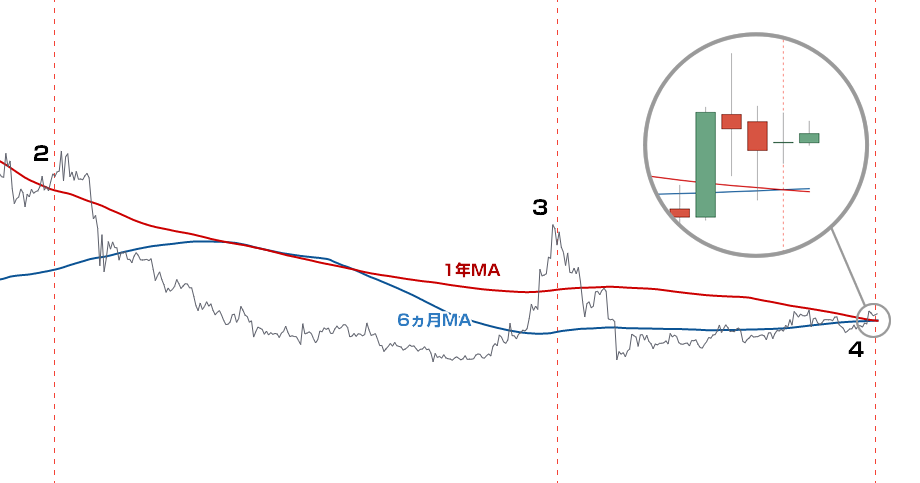
In 2 and 3, the 6-month MA clearly could not overtake the 1-year MA. Prices surpassed the two moving averages, but these were classic false signals, and they could not gain further momentum—the market was still in the crypto glacier era.
For 4, the situation is visibly different; I’ve included an enlarged view, but actually it’s even harder to read.
The day Numometer entered the troposphere (surpassed the 30 line) is marked by this red dotted line. The 1-year MA was $0.04414332, and the 6-month MA was $0.4426437, with the 6-month MA just overtaking and a golden cross forming. The next day the picture became even clearer.
Therefore, the difference between 2–3 and 4 was whether the 6-month MA had already overtaken the 1-year MA and formed a Golden Cross.
So what about 1? Here’s what happened then.
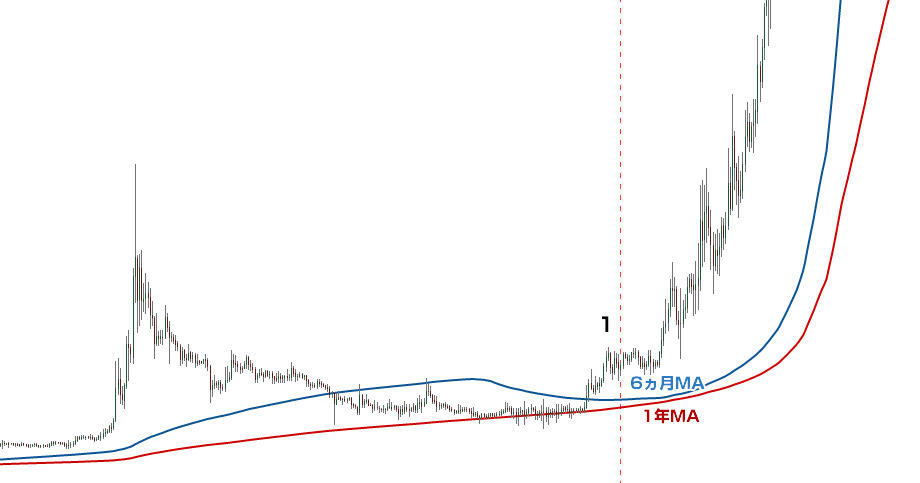
Yes, the 6-month MA was completely above the 1-year MA. At that time there were fewer past data points and not as much weight on the 1-year MA, but the conditions were favorable. After 1 formed, the price rose as shown here.
This time, with a similarly favorable setup leading to 4, will prices rise further from tomorrow? It’s closer to a 1 than to a 2 or 3, so I have some optimism.
Additionally, I ran the 1-month MA, and although not usually used, the 3-month MA and 2-year MA to observe the state.
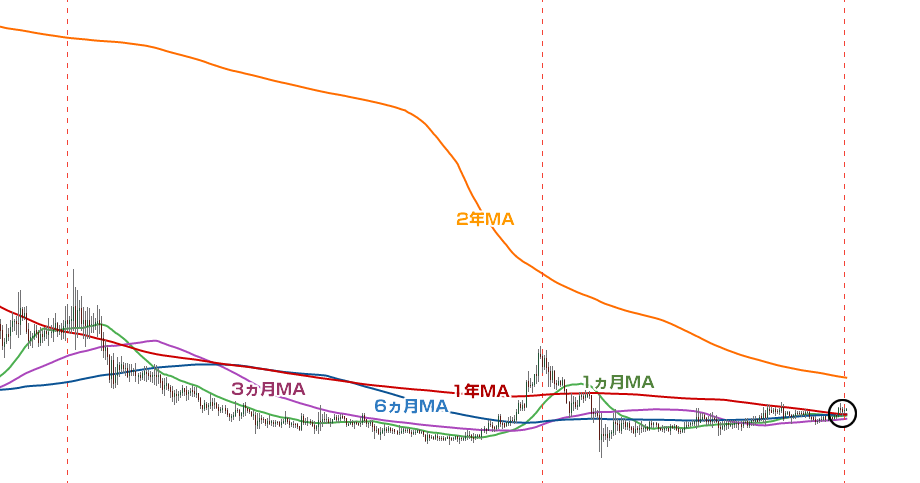
Before prices rise steeply and for a long time (or fall), moving averages tend to cluster in one spot. As time passes, moving averages from 1 month to 1 year tend to converge tightly. This is a relatively rare phenomenon. The gap with the 2-year MA has also narrowed a lot.
Prices are hovering near a bottom and zigzagging, so we might expect a rise next. But not entirely; some portion should be reserved for a possible drop as well. Things can always happen.
What lies in the jungle’s depths?

From here, this is just my own thoughts, but I think the 2017 price surge was simply a movement of a market that treated cryptocurrency as a new tradable form of money. Although tech innovations and revolutionary technologies were claimed, social implementation was almost non-existent.
Even Bitcoin—the king of crypto—was hard to use as money in everyday life, and earning or receiving Bitcoin as compensation was almost nonexistent. It remains so today.
Simply put, any given coin surged in market value as if it were a new tradable money, ICOs proliferated, and the public was swayed by this or that, until it burst on its own.
However, going forward, fundamental value will be questioned and the trend will change.

In my view, crypto assets will face questions like: what exactly are they, what kind of asset are they, and what are they used for?
Then the expectation will shift from “a new tradable money” to “an asset with practical utility that is tradable,” and as that shape becomes clearer, a calm and lasting investment demand may grow stronger daily.
As a result, it would be great if the ease of sending and receiving money also increased demand for using it as a means of payment.
With Bitcoin, since it is fundamentally money, there must be more opportunities for everyday payments, though that may still be challenging. I believe there is strong speculative demand.
So, what about NEM, a Smart Asset Blockchain? Oh, it will become Symbol, so what about Symbol?

Simple.
Symbol aims for adoption by organizations (large corporations, SMEs, ventures) and further adoption by existing companies.
By having organizations issue assets, they can make use of blockchain more effectively.
“Asset” means “assets.”
What kind of assets they are is up to the organizations, but their用途 are diverse. It is designed to be relatively easy to use for STOs, so a country might issue digital securities as assets on the Symbol blockchain.
So, observing how such organizations use Symbol will be important. Not MoUs or “plans to adopt,” but real uses of blockchain. Greater organizational use should naturally raise asset value.
It would be ideal if more organizations depended on Symbol so that it doesn’t die.
Recently, the Lithuanian central bank issued the collector’s coin “LBCoin” on NEM (and will move to Symbol). Although it is a collector’s coin, this is the world’s first CBDC issued by a central bank and issued as a crypto asset on the NEM blockchain, clearly marking this fact in history and on public blockchain.
The value of this newly issued crypto asset (LBCoin here) will be supported by the platform’s currency. On NEM, that is XEM; on Symbol, XYM.

Interestingly, the public hasn’t yet realized this value grounded in historical fact. Perhaps they are unaware or indifferent.
The once highly enthusiastic public obsessed with “a market-tradable new money,” and with the glacier age, may not yet see value in a market-tradable asset with practical utility.
Big waves are composed of small waves; vast forests are made of many trees, and markets are fractal in structure, too.
To form trends, innovators and early adopters, the early majority (look up the Innovator Theory) flow in, creating a fractal structure. So perhaps in the valuation of “cryptocurrency” we are still in the innovator phase.
That’s why we still don’t notice it, and we who wander this jungle may be smug…

It may take time, but I feel more strongly that the destination will reveal the ideal we desire.
That’s all from the jungle!
(Still cannot get out)
× ![]()