Is the USD/JPY poised for another move higher? Market analysis for this week (week of 2016/9/5)
Good morning, this is Neko Trader. (´・ω・`) Hi
I somehow managed to reach publication for last week.
Although I said “Good morning”, it was published around noon, so you might wonder, “Were you sleeping until this time?!” I couldn’t get scheduled posting to work, so I manually published at that time.
I’ll try to schedule again this time, but it might end up being a noon-good-morning again. (ノ∀`) Ahaha
Dollar/Yen market analysis
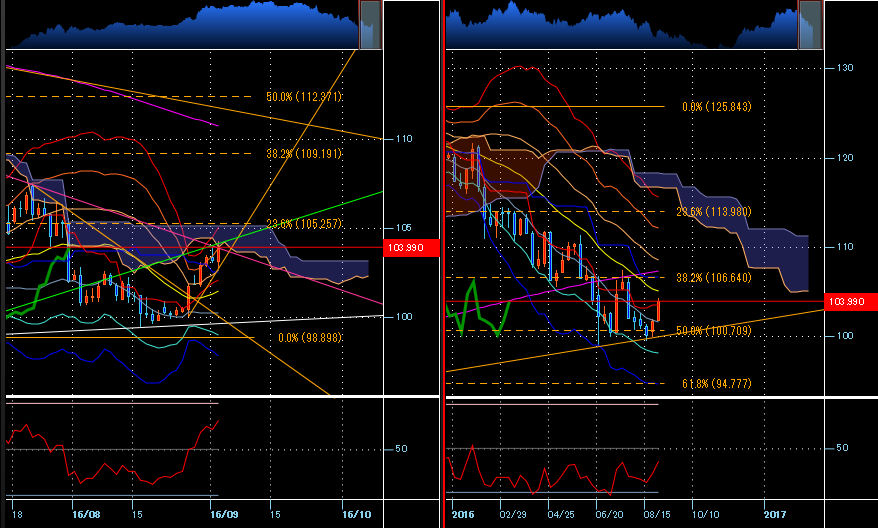
Left is the daily chart, right is the weekly chart of the USD/JPY.
【Displayed technicals】
SMA200, Bollinger Bands21, Ichimoku Kinko Hyo, RSI14
In the daily chart, Fibonacci from the high of 2015/6/5125.843 yen to the recent low98.898 yen
In the weekly chart, Fibonacci from the weekly low of 2011/10/3175.574 yen to125.843 yen
Now, the dollar/yen that surged at Jackson Hole continued its momentum last week.
On 9/1, it pierced above the line I was watching103.98 yenand I thought maybe it would turn into an uptrend!? However, due to worsening U.S. data during New York hours, profit-taking came all at once, and the price closed below the line with a bearish candlestick.
Moreover, the stopping point was perfect, stopping exactly at the pink line drawn from the green line and the high on 7/21, and it looked like it would test the downside again, but as you know, employment data caused a brief pullback before a surge, and it closed by breaking above both the green and pink lines.
The weekly bands are likely to start contracting.
This suggests the end of a downward trend, but we must not be overconfident, as patterns have repeatedly closed in and then expanded again.
However, as noted above, on the daily chart it has repeatedly broken through lines, bands have begun to expand, and a thin cloud is being respected, so this week I am fully bullish.
The upside target is105 yen low, this is where the weekly centerline and the daily Fibonacci & cloud upper bound align, so it doesn’t look like it will break through easily.
If this is broken, the weekly Fibonacci suggestsaround 106 yen midmaybe.
The downside line is a bit steep, but if the price ranges around 103 yen low since 8/27 and struggles at the start of the week, this line will rise quickly, potentially turning back down along the daily cloud, forming a ‘false breakout’ pattern since 7/21.
By the way, I hold a position.
There is a possibility of stopping out with a gap down, but I wrote details on my blog, so if you’re curious please take a look.
Euro/Dollar market analysis
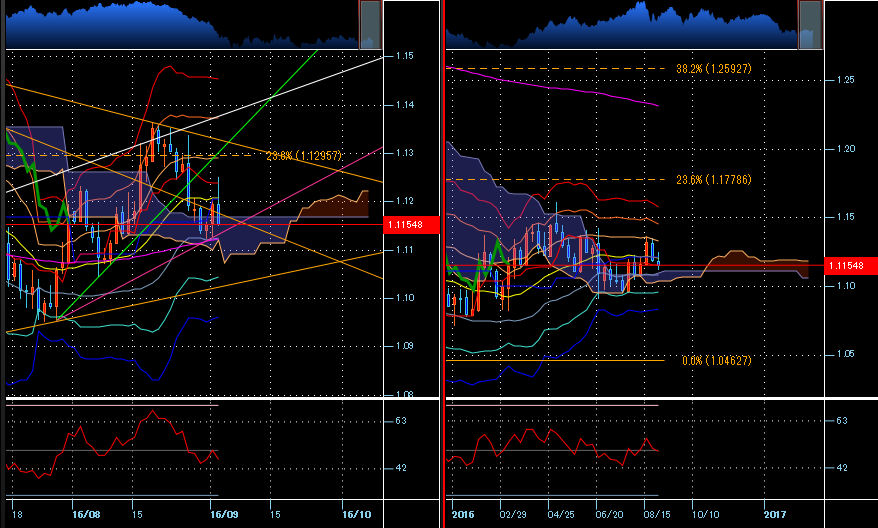
Left is the daily chart, right is the weekly chart of EUR/USD
【Displayed technicals】
SMA200, Bollinger Bands21, Ichimoku Kinko Hyo, RSI14
Daily Fibonacci from the high of 2014/5/81.39925 USD to the low of 2015/3/131.04627 USD
Weekly Fibonacci from the high of 2008/7/141.60385 USD to1.04627 USD
Mr. Range, EUR/USD remains in its usual range, and the lines that used to work are starting to lose their effect, hinting at a further retreat into a rangebound pattern. (;・∀・) Tah
If trading in line with the current dollar-strength trend, perhaps short would be appropriate by breaking the newly drawn pink line.
And near the bottom support, I would like to take profits without greed.
Rather, when the dollar strength turns to dollar weakness, I’d like to target a long position when it turns from the lower end of the range and starts rising.
So, personally I don’t think this week is a currency I want to trade aggressively.
【pick up currency!】Pound/Yen market analysis
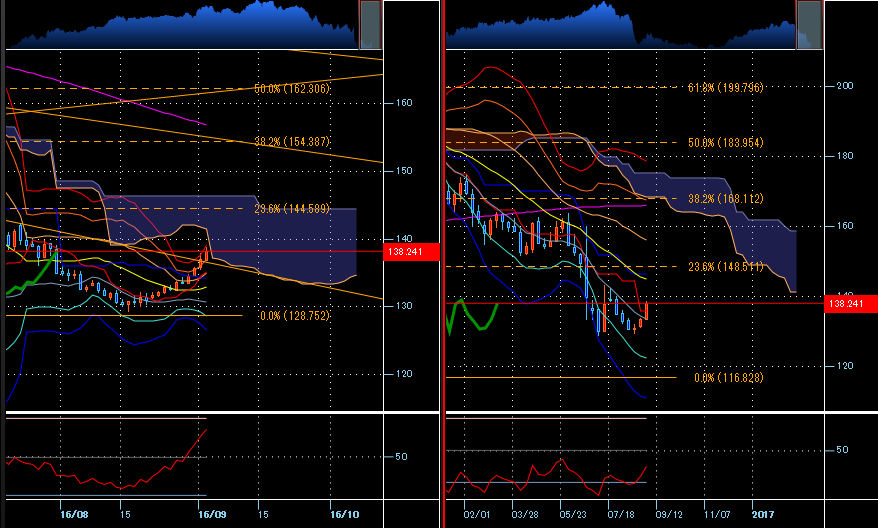
Left is the daily chart, right is the weekly chart of GBP/JPY
【Displayed technicals】
SMA200, Bollinger Bands21, Ichimoku Kinko Hyo, RSI14
Daily Fibonacci from the high of 2015/6/24195.860 yento the low of 2016/7/6128.752 yen
Weekly Fibonacci from the high of 2007/7/16251.080 yen to the low of 2011/9/19116.828 yen
Now, there aren’t many promising currencies, but I’d like to analyze the widely discussed GBP/JPY.
Since Brexit, the pound had been heavily biased to the downside, but signs of a reversal are appearing.
There were times of downside pressure, but thoughts like “UK economy is doing well…”, “the rate cut happened, but maybe that’s the last bit of news?” seem to be driving the sentiment.
As of 8/30, IMM speculative positions show GBP short at 132,133 contracts, +1,305 from the previous week, and it’s still increasing. (;・∀・) Tah
Meanwhile, longs are also entering, totaling 39,648 contracts, +3,798 from the previous week, marking a positive net for the first time in 9 weeks.
Looking at the weekly chart, technically it doesn’t yet show an uptrend and remains in a retrace scenario.
However, on the daily chart, expansion has started and volatility is rising day by day.
From this week, it would enter the daily cloud, so a classic setup may be difficult, but if it pulls back to the line broken on 9/1, it might be worth buying.
It seems to overlap with the lower boundary of the cloud, so a clear stop loss could lead to a straightforward trade.
The upside target is around the144 yen mid.
Conversely, until that level, I think selling is better waited.
Not that you should catch a falling knife, or grab a rising bow, so to speak; while it’s rising, I think it’s best to stay away from a long position.
Also, since we’ve recently seen the pound seriously move, I’d rather not tinker too much.
By the way, today is NYS holiday.
If possible, I’d like some movement by European hours… (;・∀・) Tah
Well then, everyone, may you have enormous profits this week as well! (σ・∀・)σ Getts!!