Foreign Exchange Online - Masakazu Satō's Practical Trading Techniques | Techno & Fundamental Analysis Predicting the Future of the 3 Major Currencies [This Month's Theme | The Best Way to Read the Confusing COVID Market: Develop a Big Picture View wi

Line analysis is a quite “analog” method of analysis that draws resistance lines by connecting highs, support lines by connecting lows, and horizontals at price levels where past highs and lows cluster. The way to draw them can vary from person to person, but by enclosing the price movements in my own way, I can forecast the future and develop market sense and a broad perspective. This time, let's take a look at a method to forecast the corona market using line analysis.
※This article is a republication/re-edition of FX-Kakuro.com’s August 2020 issue. The market information written in the main text may differ from current market conditions, so please be aware.
Masakazu Sato Profile

Sato Masakazu. After working at Japanese banks, he joined Paris-based Paribas Bank (now BNP Paribas). He has served as Interbank Chief Dealer, Head of Funds, Senior Manager, and other roles. Subsequently, he became Senior Analyst at the online foreign exchange service with the world’s highest annual trading volume. He has over 20 years of experience in the currency market. He also appears on Radio NIKKEI’s “Stock Complete Live Commentary! Stock Channel” and Stock Voices’ “Market Wide—Foreign Exchange Information,” and regularly provides market information on Yahoo! Finance.
What is the expected range for the USD/JPY in a trendless market according to line analysis?
Globally, the number of infections and deaths from the novel coronavirus is still surging, but economic activity is resuming in Europe, the United States, China, and Japan. There is a risk of a second wave, but going forward it seems we will be reacting to how much impact COVID-19 continues to exert on the world economy, with varying opinions about the extent of its influence.
In May, the April U.S. employment data showed an unemployment rate of 14.7%, and nonfarm payrolls fell by 20.5 million, slightly worse than the worst forecasts. However, Kashkari, President of the Minneapolis Federal Reserve, stated, “Unfortunately, the worst period for employment is yet to come,” and added, “the share of people not currently employed is actually about 23–24%.”
On the other hand, among the unemployed, permanent separations (including the end of temporary jobs) account for only 11%, and 78% are temporary layoffs, so if the coronavirus subsides and businesses return to normal economic activity, there is a possibility of early return to their previous workplaces. That said, returning to the low unemployment rate of 3.5% recorded in February would likely take one to two years.
In this context, for USD/JPY, many market participants expect a current trendless price action to continue with a near-term trading range of around 106 to 108. However, the upside for the dollar remains heavy, with the daily cloud in the high 107s and above it the 120-day and 200-day moving averages; to break through this, it is necessary to firmly surpass the mid- to high-108s. Nevertheless, MACD shows a MACD and its signal crossing in a dead cross, which warrants caution.
An important lower level is around 105 yen. If prices fall below 105, market sentiment could change dramatically. Narrowing of the U.S.-Japan interest rate differential, explosive growth of the U.S. fiscal deficit, weaker-than-expected economic data, and future discussions about the source of the coronavirus and compensation issues impacting U.S.-China relations all provide ample reasons to look for dollar-selling factors.
This time, we feature “Line Analysis” as a technical indicator series. First, please take a look at Chart ① where I applied my own line analysis to the price movements of USD/JPY before and after the COVID-19 shock.
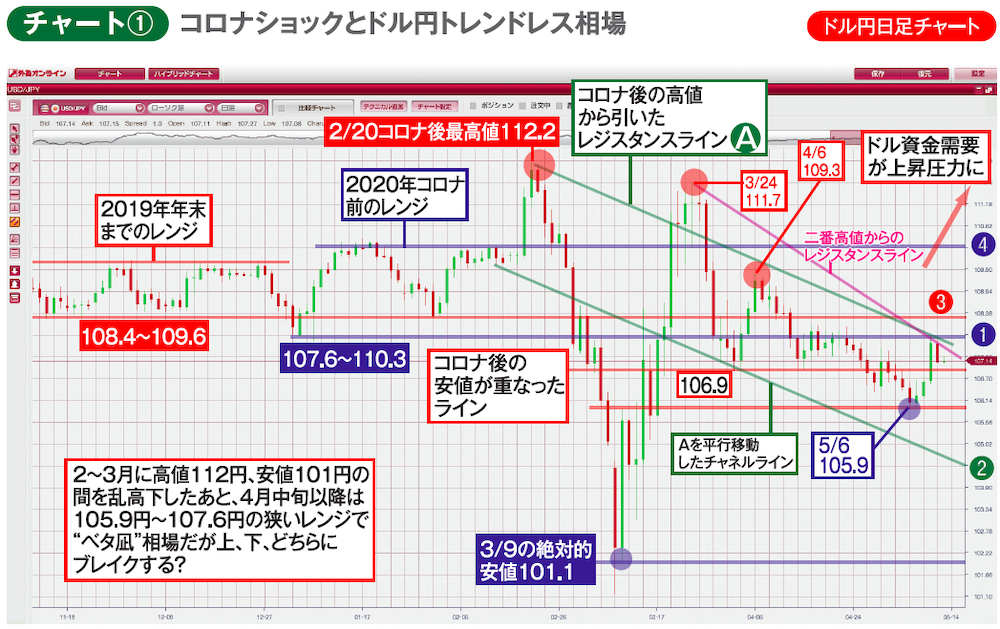

The official site of FX-Kakuro.com, Japan’s only monthly FX magazine, can be found here.