The USD/JPY is in a state of stalemate
April 29, 2017 Dollar/Yen Monthly
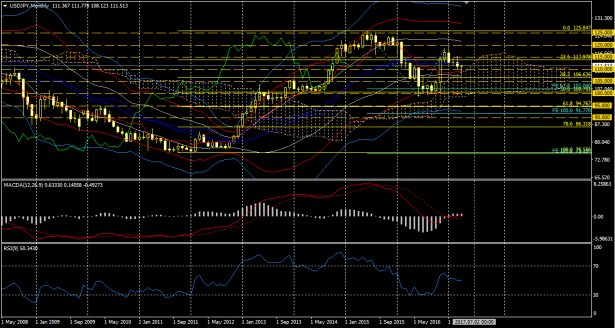
This month’s candlestick closed with a bullish lower-shadow. Seen in isolation, next month looks bullish, but when considered with last month, it simply fluctuated around the 111.5 level in both directions.
In the Ichimoku Kinko Hyo, it touched the upper edge of the cloud and was supported by the cloud, but the lagging span turned bearish, so overall there is no clear trend.
This lack of directional movement is seen in MACD, RSI, and Bollinger Bands all together.
Chart patterns suggest it is a corrective flag against last autumn’s rally.
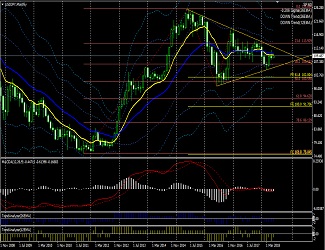
April 29, 2017 Dollar/Yen Weekly
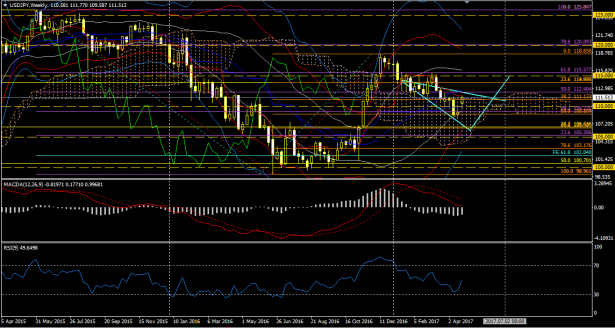
The Bollinger Bands best illustrate the market’s lack of direction: both bands are contracting strongly.
This week started with a gap up and closed bullish, returning to the former support of Leading Span 2. It remains to be seen whether Leading Span 2 will now act as resistance. It is also possible that Leading Span 2 does not act as resistance and the market trades in a range centered on Leading Span 2.
With this week’s rise, the MACD line has turned sideways just above zero. This formation is a bit concerning, and I’ll watch it closely next week as well.
From a chart-pattern perspective, I also felt it could be forming a five-wave expanded triangle.
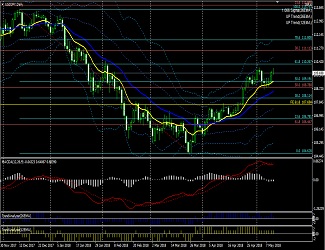
April 29, 2017 Dollar/Yen Daily
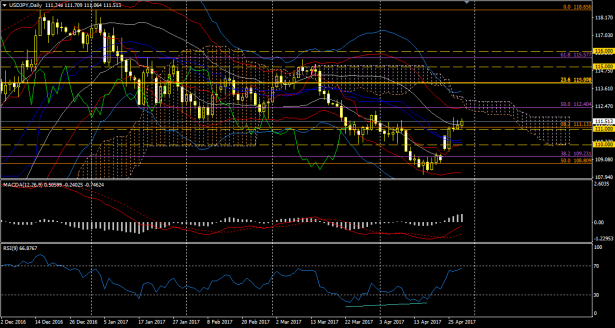
After a RSI divergence, it retraced to 111.5 in a V-shape. After Tuesday’s large bullish candle, it has been moving sideways, so there is still a possibility of moving higher. A rise up to the cloud top is conceivable.
For now, on the daily chart, nothing seen in Ichimoku, MACD, or RSI indicates a move out of the downward trend.
↓ MACD used in the above charts.

MACD alerts + Bollinger Band expansion + Trend Analyzer + Pivot
MACD (four alert options, email possible) trading system