【Free Full Text】Introduction to Tracking Trade|Episode 18: Profit of 11,348.3 pips as the euro remains strong!! [Manabu Saito]
Saito Gaku Profile
While working as a salaryman, he developed his own method in FX and achieved explosive profits in a short period. Based on that experience, he distributes FX information in various fields such as books, DVDs, article writing, and seminar teaching. Notable book: “Manabu-style FX Tracking Trade Introduction” (Jitsugyo no Nihon Sha).
Official Blog:https://fxblog1.com/
※This article is a reprint/edit of an article from FX攻略.com 2017 November issue. Please note that the market information stated in the text may differ from current market conditions.
Is the Euro the star of 2017?!
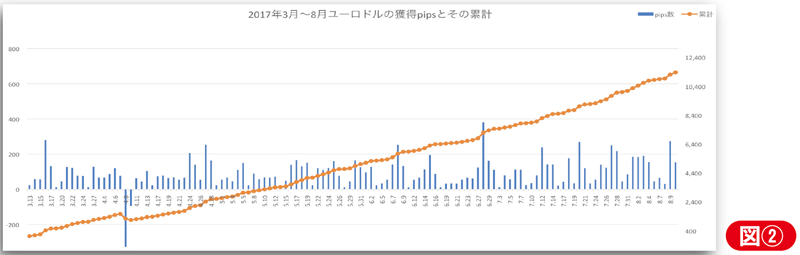
There are only three months left in the year, and the euro’s price movement and attention have become so high that you could say the euro is the star of 2017. Since March 13, the euro-dollar (long) traded in Tracking Trade has, as shown below, steadily increased in profit as of August 10, with +11348.3 pips (take profit 11772.4 pips − stop loss 424.1 pips) (Figures 1 and 2).
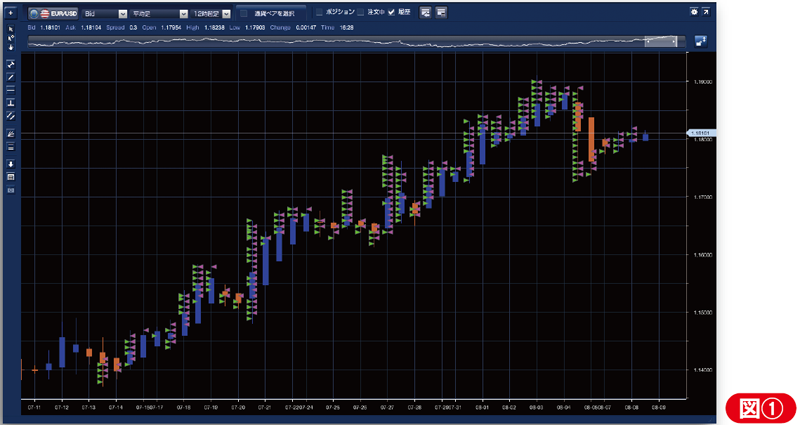
[Tracking Trade execution history July 14 – August 8 (EURUSD 12-hour)] Take profit 2593.1 pips (take profit 10 pips × about 259 times) ▲ (green) new buy ▲ (pink) close (sell)
EURUSD performance from March 13 to August 10: +11348.3 pips (take profit 11772.4 pips − stop loss 424.1 pips)
Starting in March and leaving it alone for about five months, generating +11348.3 pips in profit shows how excellent Tracking Trade is.
At the ECB meeting on July 20 (Thursday), there was discussion about tapering the quantitative easing that had been conducted. ECB President Draghi stated at a press conference that inflation remains subdued, but that “the ECB Council will decide on tapering in the autumn,” and the euro reacted strongly with buying. If tapering occurs, the ECB is expected to reduce its bond purchases, which would push euro yields higher and could keep the euro strong.
Analyzing charts in medium to long term
This time, we will check how far the uptrend that has continued since January 2 this year will go and think about an exit strategy. For that, we need to verify medium to long-term trends. We will continue to use the Heikin-Ashi candles as technical charts, but we will analyze on a weekly chart rather than a daily chart (Figure ③).
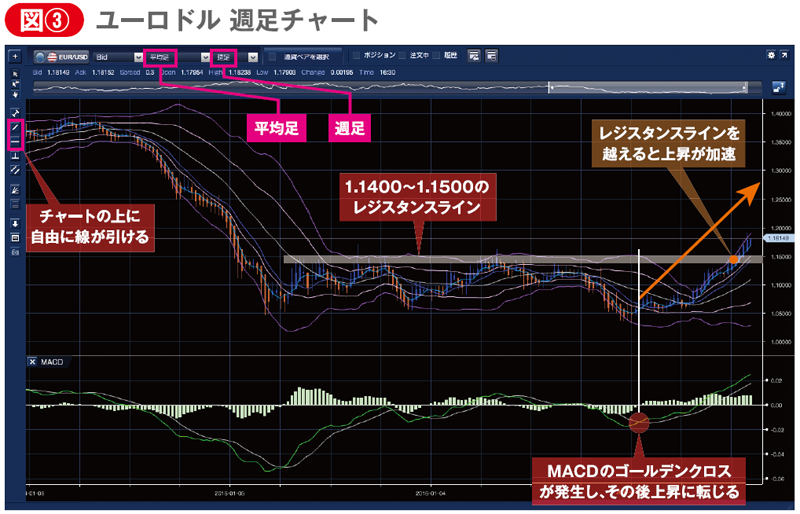
Looking at MACD first, a golden cross occurred at the start of the year, confirming a change in trend. Since then, it rose smoothly, and once it broke above the previous resistance zone of 1.1400–1.1500, the rise accelerated and the uptrend continued. In FX Pro Net’s chart, there is a line tool at the top left of the screen; by dragging on the chart you can draw lines connecting recent highs and lows, making analysis easier.
As shown here, resistance lines that mark turning points tend to accelerate the trend once broken through, due to new buying plus short-covering. In fact, it rose by more than +300 pips in a blink, but how high should we expect EUR/USD to rise?
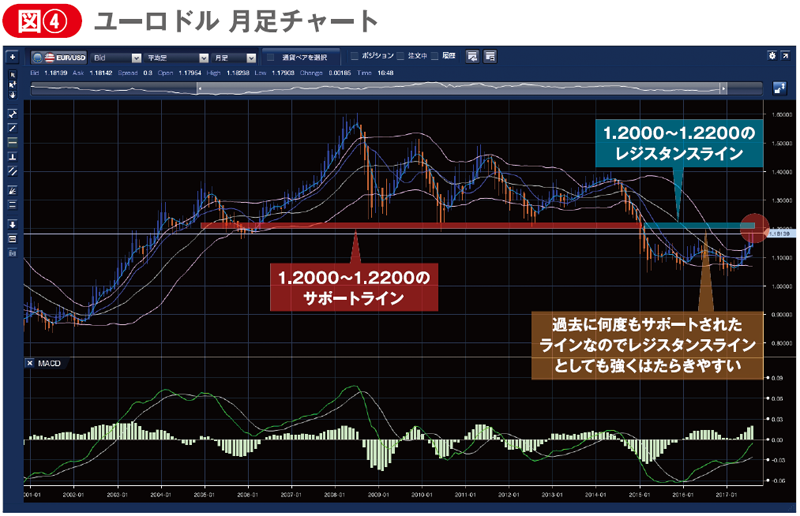
To analyze this, let us look at a longer-term monthly chart (Figure ④). It shows that from 2005 to 2014, it was supported in the 1.2000–1.2200 range for a long time. This indicates that this price range is highly significant, so even if euro-dollar continues to rise, it is expected to be resisted at this level. There may be continued buying, but historically, a price level like this tends to see profit-taking, so the momentum is unlikely to be the same as before. Even if a range is formed, Tracking Trade can still yield substantial profits. Of course, if the trend moves in the exact opposite direction as predicted, a stop loss will occur, so act quickly to manage it.
For the time being, long EUR/USD seems fine, but the 1.2000–1.2200 level is a strong resistance. If it cannot break above this level, a sharp pullback is highly likely, so it may be better to pause Tracking Trade for a while.

The official site of Japan’s only monthly FX specialist magazine “FX攻略.com” is here