Mastering the Market of Kōno no Soba? Wait, the Japanese seems to refer to a person named Kōya? The text: "荒野浩の相場を極める相場を楽しむ|第5回[荒野浩]" translates roughly to: "Hiroshi Kōya's Market Mastery and Enjoying the Market | Episode 5 [Hiroshi Kōya]" However, note
Hara no Hiroshi Profile

After joining Nikko Kamiyama丸 Securities (now Mizuno Securities) in 1971, he worked as an analyst in the Research Department. After a stint in the United States, he consistently conducted information and market analysis on Japanese stocks. In 1996, he transferred to an asset management company (now Asset Management One), serving as Director of Research and Director of Asset Management, and later as Executive Managing Director and Head of Investment Trust Operations. He retired in 2012. Since then, he has appeared on TV and radio and continued his activities. His market analysis experience focused on Japanese stocks spans nearly half a century.
Newsletter:https://www.gogojungle.co.jp/finance/salons/8812/
※This article is a reprint/re-edit of an article from FX Strategy.com July 2020 issue. Please note that the market information described in the text may differ from current market conditions.
※Data is up to April 10, 2020
Have the worst times passed?
As an indicator effective for pinpointing trading timing, I would like to first touch on the “new highs” number and “new lows” number and the “slope” of the one-month (20 days) average (data up to April 10).
■10-day cumulative peak of new highs marks a turning point
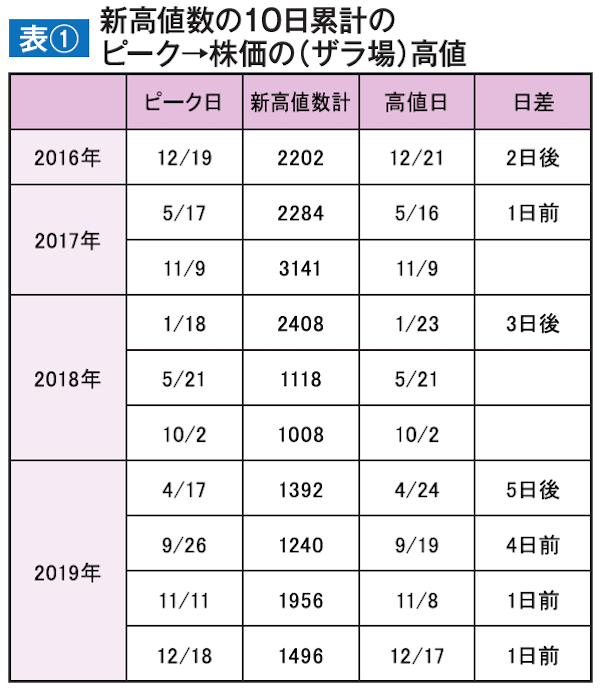
As stock prices rise and form highs, it is natural for the number of new highs to expand daily. In particular, there is a tendency for the cumulative 10 days leading up to the high to coincide almost with the high dates (Table I).
The reverse is also true: when prices fall sharply and a low is reached, the number of new lows expands rapidly, and the 10-day cumulative peak of new lows almost coincides with the low more clearly than with the high (Table II). This makes it a useful timing indicator for trading.
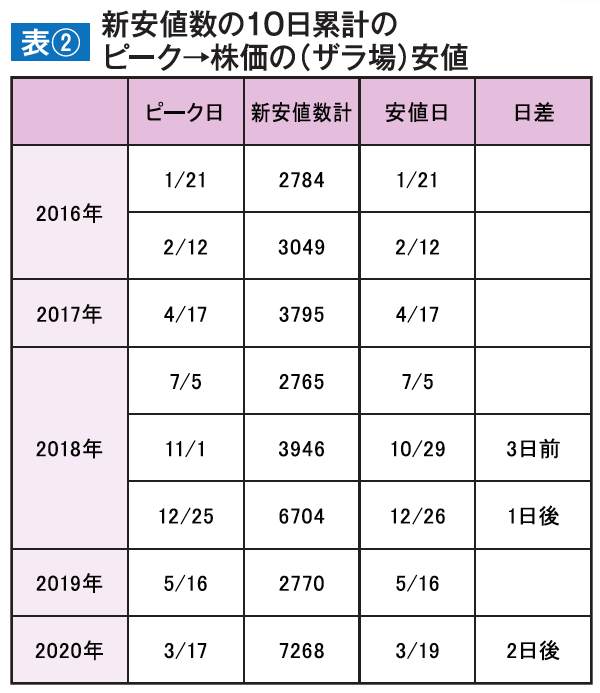
In the high-price zone, the 10-day cumulative peak of new highs is a sign of a peak, and in the low-price zone, the 10-day cumulative peak of new lows indicates a bottom, often marking a turning point.

The official site for the only Japanese monthly FX specialty magazine “FX Strategy.com” is here