

Yohwa Nanami and the Aspiring Trader! Learn FX with Nanamin Episode 12
Actress and investor Nanami Hiwa joins with FX specialist Yasushi Yamanaka to learn with everyone what is necessary to profit in FX, aiming to improve trading performance. This time, as an application of technical analysis, a custom indicator will be introduced.
*This article is a reprint and edited version of an article from FX Survival Guide.com July 2020 issue. Please note that the market information written in the body may differ from the current market.
Click here for the list of serialized articles
【Table of Contents】Aim to become a real trader with Nanami Hiwa and Nanamin learning FX
Profile of Yasushi Yamanaka

Yamanaka Yasujirō. Joined American Bank in 1982, promoted to vice president in 1989, Proprietary Manager in 1993. Joined Nikko Securities in 1997, Deputy Manager of Forex Funds at Nikko City Trust Bank in 1999. Founded Ascendant Co. and served as Director in 2002.
Official Blog:FX information distribution site provided by Ascendant/Yamanaka Yasujirō
Twitter:https://twitter.com/yasujiy
Profile of Nanami Hiwa

Hiwa Nanami. Formerly Nonaka Nanami, changed to Hiwa Nanami. Belongs to Tezuka Hiroshi Office. Active as an actress and investor, appearing in films, stage plays, and commercials, and hosting a regular program on Radio Nikkei. Updates her daily trading on her blog.
Official Blog:FX Actress Arrival! The serious real-trade diary of rising actress Nanamin
Twitter:https://twitter.com/himnas03
MTF Moving Average Across Multiple Time Frames
HiwaSince the last time, we have had Mr. Yamanaka explain the recommended custom indicators. Please continue to guide us this time as well.
YamanakaThis time I will introduce two tools: a trend-based “MTF Moving Average” and a counter-trend tool “Pivot Zone.”
HiwaFirst, could you explain the MTF Moving Average?
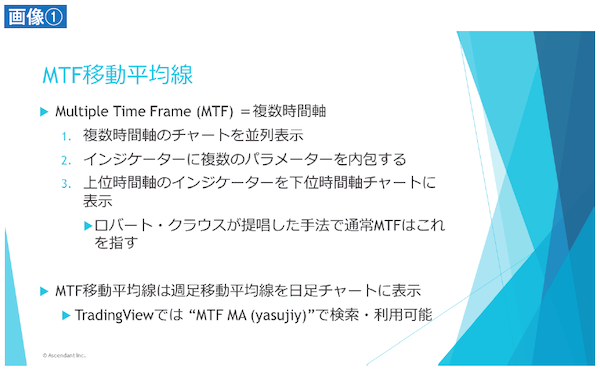
YamanakaMTF stands for Multi-Time Frame (multiple time frames) (Figure ①). It is famous as Elder’s “Triple Screen,” which originally displayed charts of different time frames side by side. The screen shows three charts—monthly, weekly, and daily—arranged together in a very simple setup, from which MTf developed. There is also a custom indicator called the “KST (Know Sure Thing) System” that mixes four parameters within a single indicator.
The current MTF Moving Average is a method of displaying a higher-timeframe moving average on a lower-timeframe chart. This method was proposed by well-known trader Robert Krause, who also appears in the book “The Magic of the New Market.” When people say MTf these days, this is almost always the method they refer to.
HiwaSo you don’t need to switch charts or display multiple charts; you can see longer-term movements on a single chart.
YamanakaThat’s right. Let’s actually look at a USD/JPY daily chart since the end of 2019, when the MTF Moving Average displayed on a weekly chart became common (Chart ①). The custom indicator shown here is one I created. A 20-week simple moving average (SMA) is displayed as a red line.
