Dollar/Yen: Could the downside be quite deep? [2017-04-15]
There is a sense that an incident could occur today or tomorrow, but for now I will analyze the current situation.
April 15, 2017; USD/JPY; monthly chart
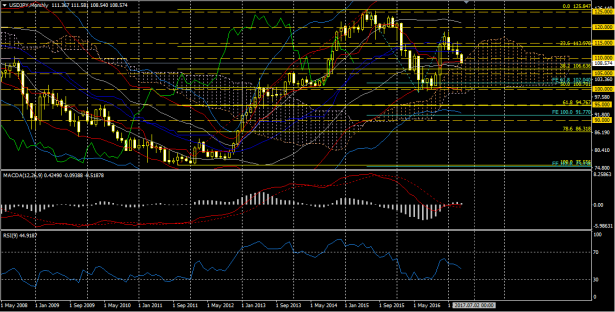
Although we are still in the middle of the month, first I will look at the monthly chart.
Looking at it on a yearly basis,
2015; Open: 120.413; High: 125.847; Low: 115.845; Close: 120.237; bearish candlestick doji
2016; Open: 120.173; High: 121.682; Low: 98.961; Close: 117.022; bearish candlestick hammer
and thus this year's decline is understandable.
From the adjustment wave since the 2015 high, drawing Fibonacci expansions shows that 61.8% is 102.040 and 100% is 91.770, both of which are quite deep points.
Since the Fibonacci expansion 100% lies between the Fibonacci retracement 61.8% and 78.6%, you should consider that an adjustment phase up to around this area could come someday.
Currently, the candlesticks are sinking into the cloud. Whether the wicks end within the cloud or exit the cloud will greatly affect the next move.
At present, there is a strong sense that the Trump rally after the presidential election is retracing fully.
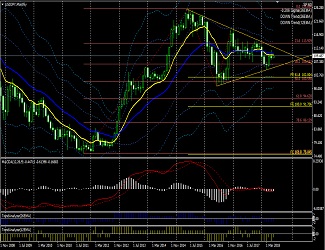
April 15, 2017; USD/JPY; weekly chart
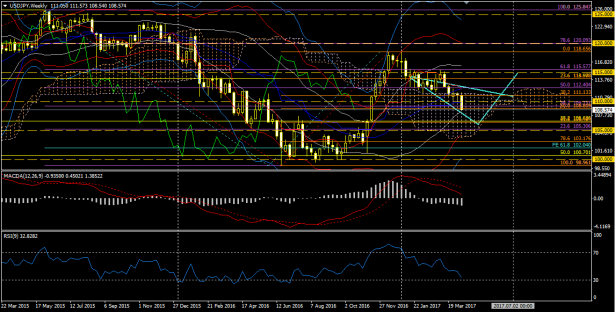
The leading span 2 on the weekly chart has ceased to function as support.
Currently, it is near the Fibonacci retracement (orange) drawn from the last year's low to the post-election high around the 50% level. Until RSI reaches 30, it may continue to fall. What the market is aiming for now is Fibonacci retracement 61.8%, i.e., around 106.5. After that, RSI could persist near 30 while slowly moving downward as a possibility.
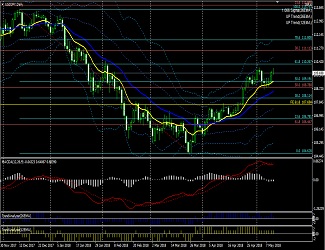
April 15, 2017; USD/JPY; daily chart
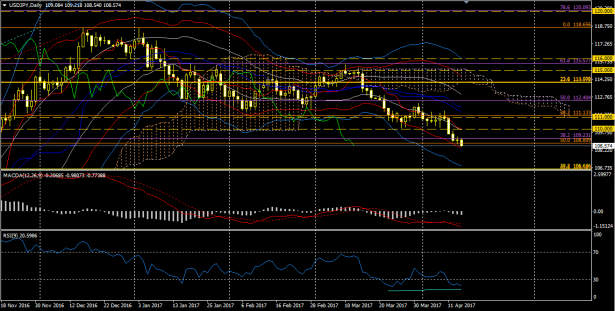
The RSI divergence is currently present, but depending on next week's movement, it could disappear.
From a wave perspective, it seems to be forming a 5th wave extension. If so, it will still go lower.
↓ The MACD used in the above charts.

MACD alert-enabled + Bollinger Band expansion version + Trend Analyzer + Pivot
MACD (four alert types, email capable) trading system