

Pound/Yen Target Point for Next Week (December 22)
■GBP/JPY Weekly Target Points
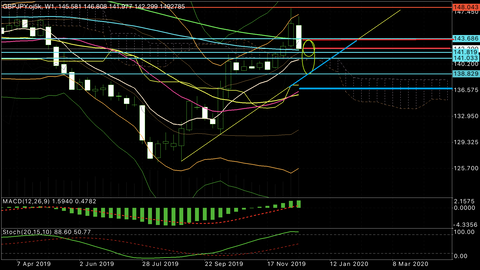
This week, the price was capped by the +2σ of the Bollinger Bands and reversed, and it almost formed a bearish engulfing pattern by breaking last week's low, so next week looks to be dominated by selling on rallies.
If it starts above the 90-day line at the beginning of the week, there is a possibility of a test of the rally, and in that case the area where the 200-day line sitsaround 143.50 to 143.70would be watched as it begins to drift down.
If at the start of the week it gaps down and begins near the 90-day line, the decline is likely to continue,around 142.00and if it breaks below, the 10 EMA around141.03 to around 141.00is a zone where a rebound could be expected for a while, but it is also a point where cloud twists occur, so selling pressure may appear, and if selling is strong and it breaks the 10 EMA, the outlook could become quite tough.
On a weekly basis, there is a neck-line around139.33and there is a supporting trend line around138.70with some room for movement, so a rebound is expected here, but if the rebound is weak, a drop toward the standard line or the middle line aroundmid-136sshould be watched.
Since it's year-end, movements may be limited, but anything can happen, right!?
■GBP/JPY Daily Target Points
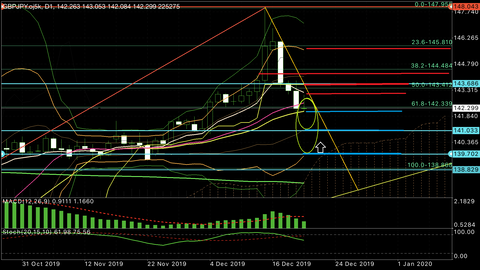
On the daily chart, Friday tested a rebound near the 25-day moving average as support, but was capped near the area of the downward-sloping 10 EMA, resulting in a long upper wick and a close near a bullish candle with a longer upper wick.
In the area above the 25-day line (around 142.18), the close remains above, so Monday morning will be a question of whether price remains above the Friday support at the 25-day line or dips below.
Since there is an upper wick, selling pressure is strong, so even if it starts above the 25-day line, be mindful of a pullback. Given the year-end, if price stays small in range, it might not test new lows. On a daily basis, if Monday also finds support at the 25-day line, aim for a range around the 142s.
Lower target is around142.10and the upper target is near the middle line around142.60and the highs from Friday and the area of the 10 EMA around143.00 to 143.07.
If it breaks below the 25-day line and falls to the 141s,around 141.80 or 141.55 to 141.50and the area of -1σ around141.15becomes a zone to watch for further declines.
※The chart will change at the start of the week, so please check the rates near the defined points!
■Early Week Outlook
I would like to see a gap up at the start of the week, but basically the market looks to be biased to selling on rallies.
In the year-end period, due to Christmas holidays in the West, the market is expected to be range-bound with light movement, and with year-end activity, there may be closing-type moves, so be cautious of attempts to trigger positions when the market opens or closes.
Also in such times oscillators tend to underperform, and indicators or EAs may not perform well, so it might be good to study and backtest during year-end and prepare for next year.
Also in such times oscillators tend to underperform, and indicators or EAs may not perform well, so it might be good to study and backtest during year-end and prepare for next year.
When talking with traders, I often hear, “I’ve learned a lot of technicals, but I’m scared to enter at the target point, and as a result I miss moves I expected and feel wasted.”
Even if you understand the technicals, unless you enter and exit in demo or real trading, your experience won’t grow and your confidence won’t rise.
I think you should enter at your target point, and if price doesn’t move as expected, exit immediately.
Basically do not overdo it, but simply waiting around won’t make you a better trader, so trading in a demo or even a small amount is the short path to improvement!
※GBP/JPY is highly influenced by fundamentals, so when it moves rapidly, do not fight the flow!
Well then everyone, have a great weekend!!
――――――――――――――――――――――――――――――――――――――――――――
Scaletrade Fuuta’s daily market bloghttp://fxfighter-fuuta.link/
Fuuta’s technical study sitehttp://fx-fuuta.com/
Fuuta’s Twitter@fuuta_fx_trader
――――――――――――――――――――――――――――――――――――――――――――
◆◆◆ Highly popular indicator!! ◆◆◆
1) An indicator that tells you timing you’ve never seen before
2) A new series Victory.ver indicator
× ![]()