This week's market analysis from the Bollinger Bands (week of 2016/8/29)
Good morning, this is Neko Trader. (´・ω・`) Hi
I wonder if this will upload correctly…? (;・∀・) Ta-la
I’m somewhat an old-school Showa-era person, so I’m not very good with machines, but I’m stubbornly writing this article.
If there are any unsightly points, I’m sorry. (´・ω・`) Suma
Dollar/Yen market analysis
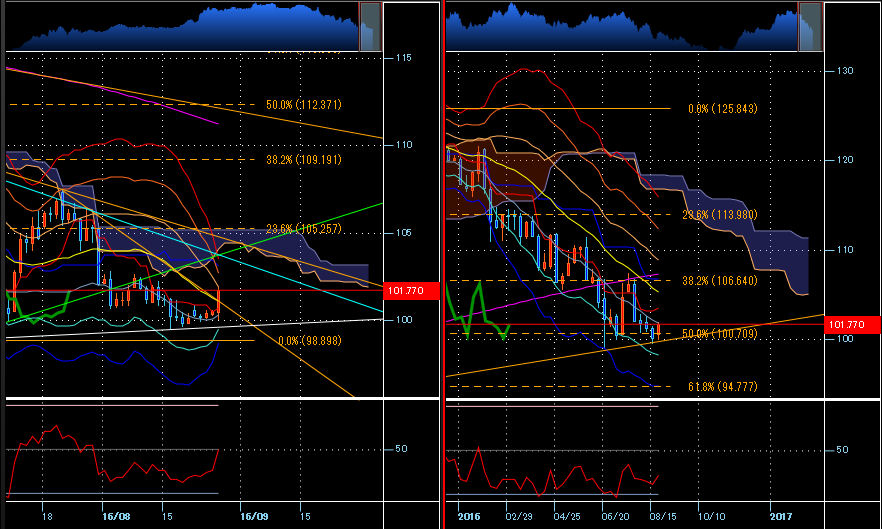
On the left is the daily chart, on the right is the weekly chart for the USD/JPY.
【Displayed technical indicators】
SMA200, Bollinger Bands, 21, Ichimoku Kinko Hyo, RSI14
125.843 yen to the recent low of98.898 yen
The weekly Fibonacci ranges from the weekly low on 2011/10/31 of75.574 yen to125.843 yen
Before I knew it, August is already nearing its end, and two-thirds of the year has passed. Σ(゜Д゜; No way!
Meanwhile, the US has raised rates last year and there have been zero additional rate hikes since.
Attention focused on when the next rate hike would occur, highlighted by Janet Yellen’s speech at Jackson Hole last Friday.
I thought what she said wouldn't change much from before, and it ended up buying,to 100.88 yento 100.88 yenthen reversed and a counter-move was triggered!
I thought it would retrace fully and test the downside below 100 yen,to 100.06 yenand then reversed again! Σ(゜Д゜; No way!
After that, there was a one-sided dollar-buying move, breaking through the daily center line and the recently drawn resistance line,to 101.93 yenand closed near the high.
Last week, I expected a break to occur if the weekly trend headed downward, but it rose without testing that line.
The daily ended with a big bullish candle on Friday, and this week could see an upside breakout.
The weekly is still down, but support has been clearly established; since trends change from shorter time frames, this could be a very important week for forecasting future moves.
Key upper levels to watch include the recent high of 8/2 at102.82 yen, and once it breaks, the blue line that once acted as an important level around103 yen mid to lower, and the line about 50 pips above the July 21 fakeout.
Support levels are the daily white line at99 yen high, with the most recent low of99.52 yenin focus.
Whether going long or short, I plan to enter after a slight pullback or upon a break as these points are considered.
Euro-Dollar market analysis
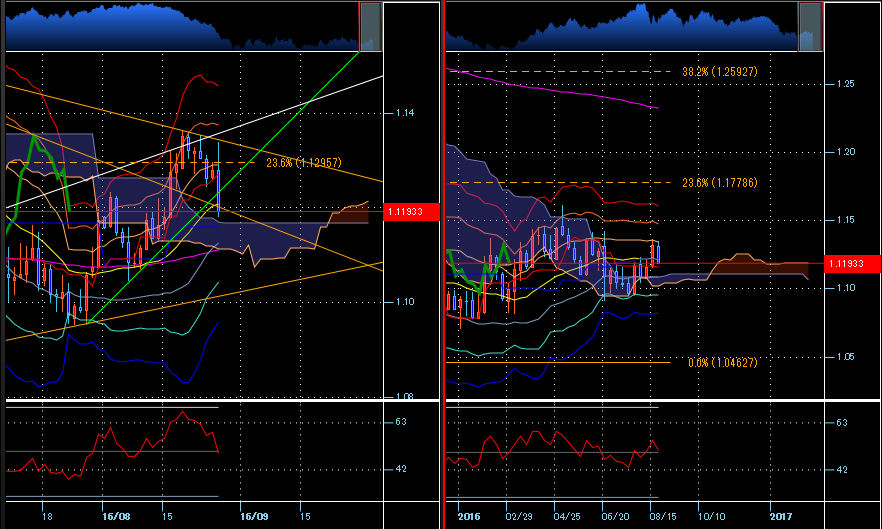
On the left is the daily chart, on the right is the weekly chart of EUR/USD.
【Displayed technical indicators】
SMA200, Bollinger Bands, 21, Ichimoku Kinko Hyo, RSI14
The daily Fibonacci ranges from the high on 2014/5/8 of1.39925 dollars to the low on 2015/3/13 of1.04627 dollars
The weekly Fibonacci ranges from the high on 2008/7/14 of1.60385 dollars to1.04627 dollars
Mr. Range, EUR/USD really forms such clean charts lately. (´∀`*) Hehe
I thought it had broken the white line, but failed; the resistance line drawn by connecting that high has kept ceilings on 8/23 and at Jackson Hole on 8/26.
When dollar-buying emerged at Jackson Hole’s early moment, it also rebounded at a steep green line, then rose and turned downward again; I took a short when the green line broke.
I thought it wouldn’t move in one-sided fashion, and since I was a bit afraid to hold overnight, I traded short-term. If the dollar strong rally continues, those holding dollar-buying positions in USD/JPY might also aim higher, as with EUR/USD.
EUR/USD is in a range, currently around the middle of the daily triangle; if entering from here, one would aim to sell on rallies and buy on dips.
Now, normally I would analyze one more pick-up currency, but I’ve already spent nearly twice as much time as planned. (;・∀・) Ta-ra
Also, the color tones and fonts are so plain. What a dull article this is. (ノ∀`) Ah-cha
I am reminded of the editor-in-chief’s high editing capability.
To make such a glamorous article would take me a whole day.
So, I’d like to end this article with a magical phrase.
simple is the best!!
Yes, I feel I could definitely become friends with the person who came up with this phrase. (´∀`)b
Well then everyone, here’s to another week of huge profits! (σ・∀・)σ Get!!