

Understanding "MACD" by Iwamoto Max: Part 1 [Max Iwamoto]

Max Iwamoto Profile

Keisuke Iwamoto. As his nickname "Non-graduate Certified Technical Analyst" suggests, he is a rare no-education analyst in the analyst industry. Even in today's era where educational background remains significant, he continues to strive daily against the FX market where such things do not matter at all. With the feeling of "now that anyone can easily start FX, I want you to acquire solid skills to keep winning," he serves as a author for a series and as a seminar lecturer.
※This article is a reprint/edit of an FX攻略.com March 2018 issue article. Please note that the market information stated in the main text may differ from the current market.
Technical derived from Moving Averages
From this issue, we will cover MACD, from basics to applications and practical usage. MACD is an indicator that shows the convergence and divergence of moving averages, and it measures not only the direction of the trend but also its strength and momentum.
Also, when displayed on the chart, it is shown in a sub-window just like oscillators such as RSI, so MACD is sometimes classified as an oscillator indicator; however, as mentioned earlier, it is based on moving averages, a leading trend indicator, so it is undoubtedly classified as a trend indicator.
MACD was introduced by Gerald Appel in the 1970s, and later evolved further with additions such as "signal" and "histogram" up to the present day.
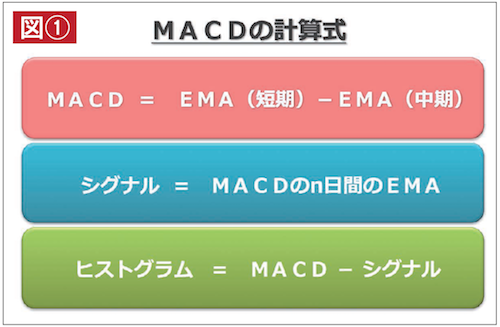
Their calculation methods are as shown in Figure ①, a simple one that subtracts the short-term moving average from the medium-term moving average. Regarding parameters, except for advanced users, most people adopt the original settings of short-term EMA12, mid-term EMA26, and signal 9 as they are.


