
[Intermission] Delve a little deeper into the moving average convergence/divergence & EURUSD H1 2017/3/30 Harmonic状況
■ Harmonic and Moving Average Deviation
As an intermission, I’d like to delve a little deeper into the moving average deviation.
The moving average deviation is,
・A abnormal deviation
・Deviation trend break
These two points are fundamental.
Now, how much deviation should raise a red flag?
Immediately, let’s compute the standard deviation. Speaking of standard deviation, Bollinger Bands come to mind, but in a blog article I note that the Close values relative to Bollinger Bands do not follow a standard deviation distribution.
[Verification] Moving average is late!!!!!!!
http://mt4program.blogspot.jp/2015/10/blog-post_83.html
What about the deviation?
Deviation (SMA21) versus standard deviation (21) dispersion
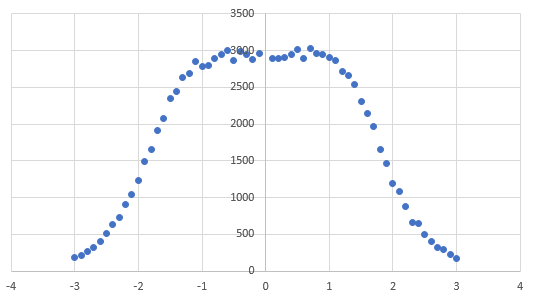
In the case of deviation, within 1σ it remains flat, and once it goes beyond about 1σ, it quickly decreases.
Compared with Bollinger Bands, it seems to have stronger stay within ±1σ.
My preferred conclusion is that price should be viewed in terms of rate, not in terms of absolute value.
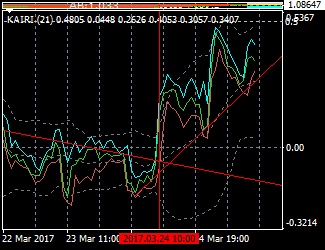
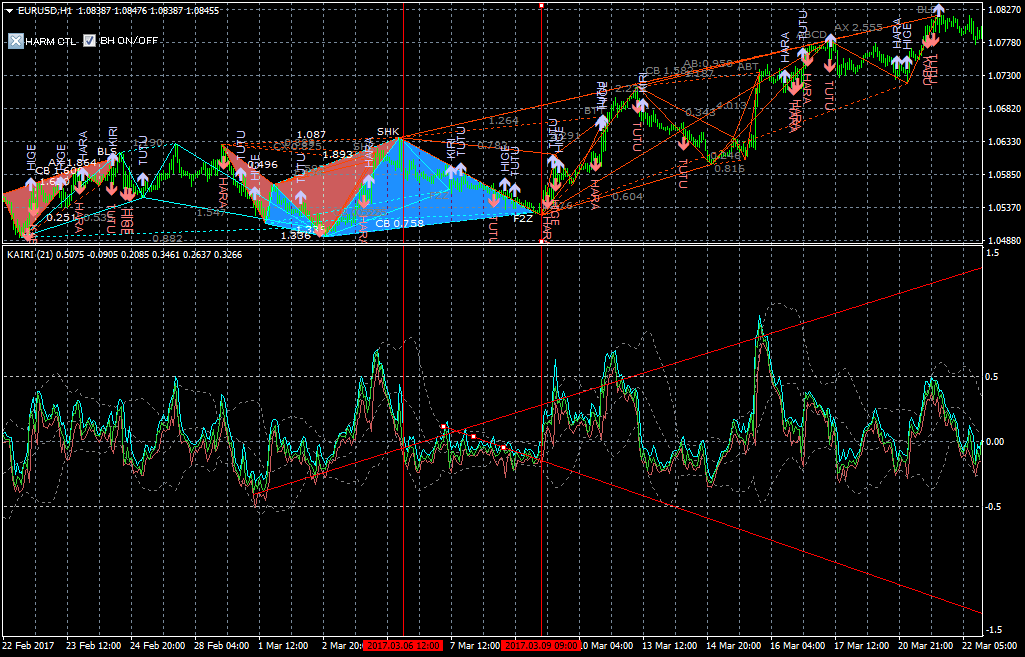
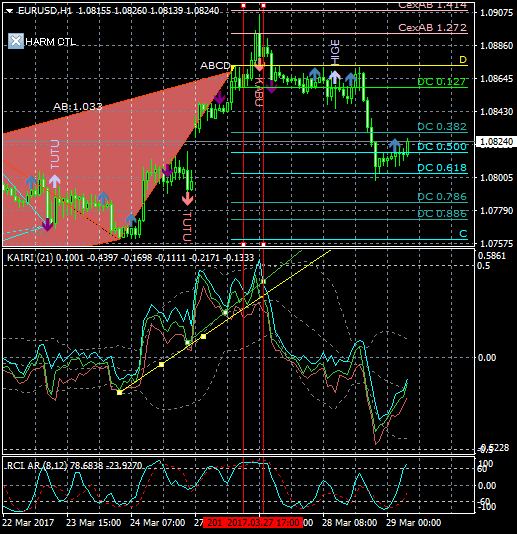
So, the indicator used in the chart image that shows the deviation’s standard deviation bands alongside is what I’ve used here.
So how does it actually look?
I looked at the position of σ relative to long-term dispersion.
This time I was able to capture it cleanly.
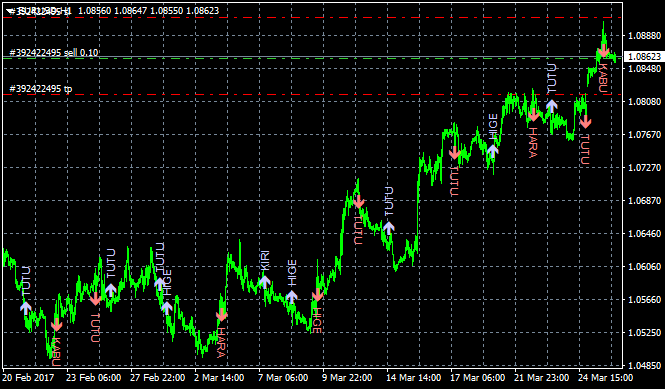
Analysis status of each indicator.
RCI arrows are purple, price action arrows are pink.
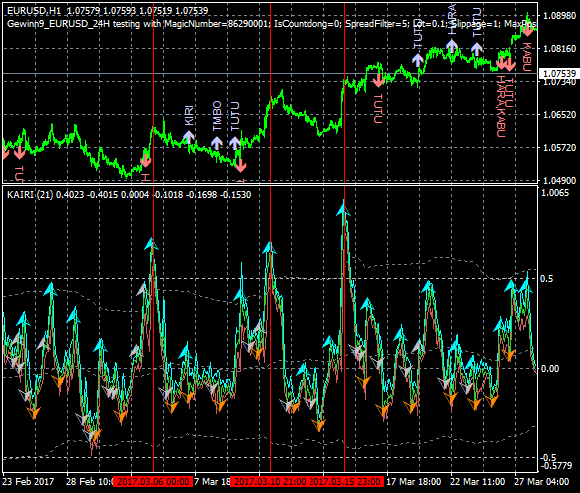
The red vertical line marks the manual drawing of the deviation trendline break timing.
■ Post-trade & Analysis
Bonus
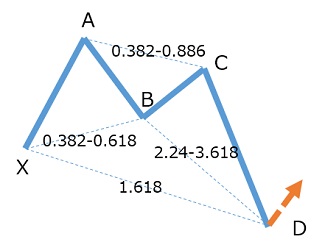
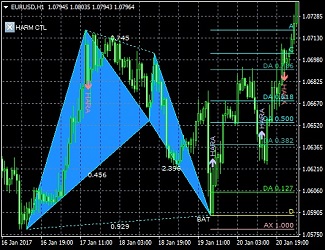
■ 2017/03/30 10:50 EURUSD H1 Harmonic status
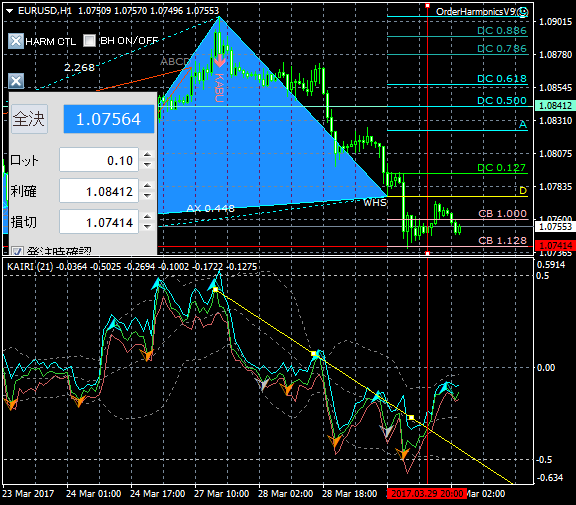
The White Swan shape on EURUSD H1 isn’t great, but since the deviation trend has broken, if it returns to point D, I’d like to buy.