

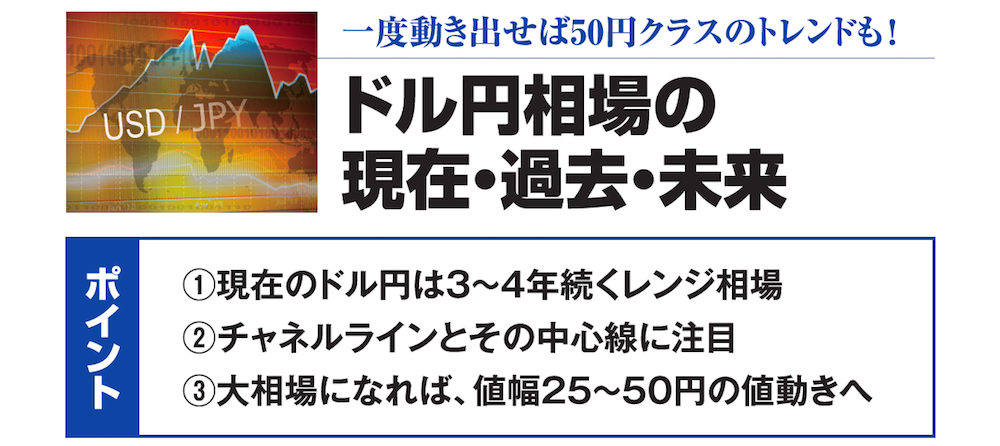
A major opportunity to increase assets is coming soon!! A huge bull market 【3】 Once it starts moving, trends at the 50-yen class are possible! Current, past, and future of the USD/JPY market
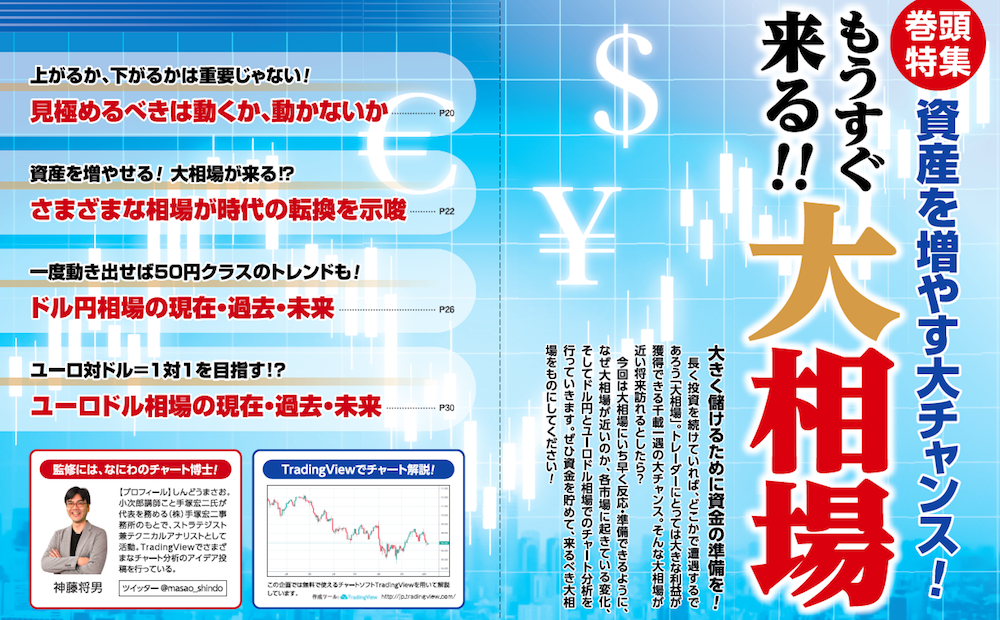
Prepare funds to make big profits!
If you invest for a long time, you will encounter a “great bull market” somewhere along the way. For traders, it is a once-in-a-lifetime big opportunity to earn substantial profits. What if such a great market were to come in the near future?
This time, to respond and prepare quickly for a big market, we will explain why a major market is imminent, the changes occurring in each market, and perform chart analysis on the USD/JPY and EUR/USD markets. Please save up funds and seize the forthcoming big market!
*This article is a reprint/edit of an article from FX攻略.com December 2019 issue. Please note that the market information written in the body may differ from current market conditions.
Supervising Expert: Masao Shindo, The Chart Doctor of Osaka! profile

He works as a strategist and technical analyst under Kojiro Tezuka’s office, Tezuka Koji Office, where he serves as representative. He posts various chart analysis ideas on TradingView.
Twitter:https://twitter.com/masao_shindo
Table of contents — A great chance to grow your assets! The imminent big market is coming!!
【1】Whether the price goes up or down is not the key! What to discern is whether it moves or not
【2】Increase your assets! A big market is coming!? Various markets signal a turning point of the era
【4】EUR/USD aiming for parity 1:1!? The current, past, and future of EUR/USD
Interpreting the current USD/JPY market
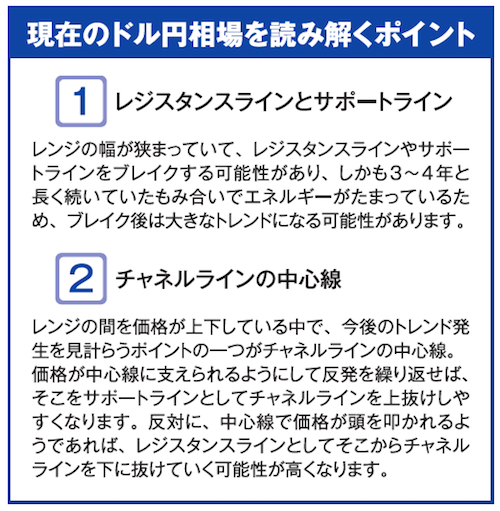
Looking at the USD/JPY on a monthly and weekly basis, there has not been a major trend as in the past, and the market has been relatively stagnant over the last 3–4 years. Key points to read the future USD/JPY are the upper resistance line and lower support line, as well as the center line of the channel.
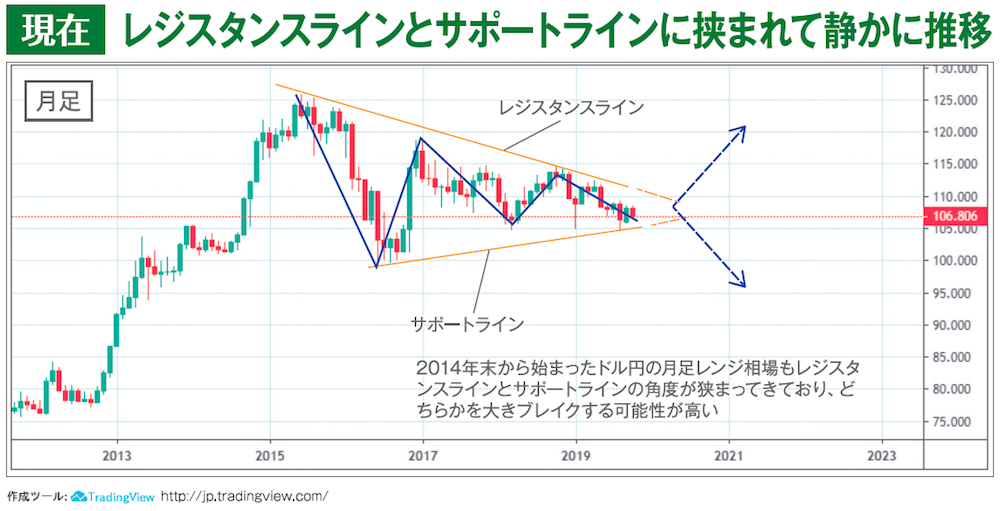
When checking the monthly chart of USD/JPY, the resistance line formed by connecting the highs since 2015 is sloping down, while the support line formed by connecting the lows is gradually rising, creating a triangle where the gap between the resistance and support lines narrows. In the future, the price is more likely to break either of these narrowing lines. Also, as seen on the monthly chart, the prolonged range with no major trend suggests that once a break occurs, the market could move significantly and a trend may emerge.


