

Nanaka Nonaka aims to become a full-fledged trader! Learn FX with Nanamin Part 6
Nanami Nonaka, a porn star, joins with FX specialist Yasushi Yamanaka to learn with everyone what is necessary to profit in FX, aiming to improve trading results. This time, he will teach the basics of technical analysis.
※This article is a reprint and revised edition of an article from FX攻略.com December 2019 issue. Please note that the market information written in the main text may differ from the current market.
Click here for the list of serialized articles
【Table of Contents】Aim to become a proper trader with Nanamin! Learn FX with Nanamin
Profile of Yasushi Yamanaka

Yamanaka, Yasushi. Joined American Bank in 1982, promoted to vice president in 1989, Proprietary Manager in 1993. Joined Nikko Securities in 1997, Deputy Manager of the Foreign Exchange Fund Department at Nikko City Trust Bank in 1999. Founded Ascendant Inc. and appointed director in 2002.
Official Blog:Aascendant/Yasushi Yamanaka's Foreign Exchange Information Distribution Site
Twitter:https://twitter.com/yasujiy
Profile of Nanami Nonaka

Nanaka Nanami. Born March 17, 1997. From Fukuoka Prefecture. While appearing in films, stage plays, and commercials, she is active as an FX actress, also hosting a regular program on Radio Nikkei. Her blog updates daily trading activity.
Official Blog:FX Actress Onstage! Serious Real-Time Trading Diary of Rising Actress Nanamin
Twitter:https://twitter.com/himnas03
Technical Analysis and Types of Charts
NanakaIn this series, “Learning FX with Nanamin,” we have been learning FX under Yamanaka-sensei, and now we will dive into technical analysis. Please look forward to it, Yamanaka-sensei.
YamanakaFirst of all, what do you think technical analysis is?
NanakaIs it analyzing price movements from charts?
YamanakaThat’s roughly correct, but technically, technical analysis is a method that uses the four price points—open, high, low, and close—and the volume to forecast future prices.
NanakaIn FX, we mainly analyze using the four values of high, low, open, and close.
YamanakaExactly. Nanamin, what kind of charts do you usually look at?
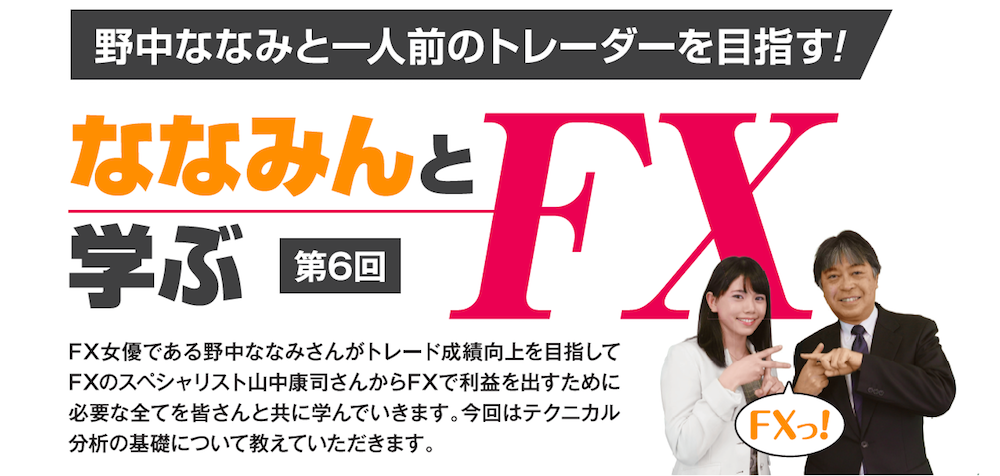
NanakaI mainly look at candlestick charts and Heikin-Ashi charts.
YamanakaAmong those, this time we will look at various chart types (Image ①). First, the simplest chart in the charts is the line chart that connects only closing prices. Line charts display only the closing price even if highs and lows move significantly, so they have a special use. For example, if the upper wick updates the high but the close does not update the high, the high is omitted. People who focus on the closing price can treat this as a less energetic high, so they use the line chart.


