
What is a harmonic pattern?
Nice to meet you, everyone. My name is Daisuke, and I am developing indicators.
Recently, I have been researching contrarian trading using harmonic patterns and price action.
At first I planned to extract ratios based on ZIGZAG, but taking into account everyone's opinions, from recursive analysis of waveforms to external files defining harmonic patterns and an On/Off display feature, it has become a very feature-rich and luxurious indicator.
There are many harmonic pattern detection indicators available in the market, including free ones, so even if you are not using my indicator, I aim to publish useful content in this series. Thank you for your continued support.
Now, without further ado, I would like to introduce harmonic patterns.
A harmonic pattern is a waveform analysis method based on Fibonacci developed by Grand Works of Canada (https://www.fxgroundworks.com/).
When a chart draws a wave, it is statistically confirmed to show a reversal point with high probability. In practice, when displayed on a chart, the probability is not as high as Grand Works claims, but there are times when it indicates reversal timing.
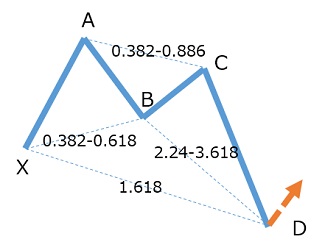
The basic idea in harmonic patterns is as follows.
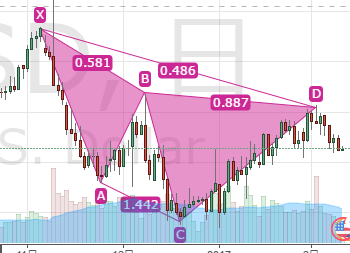
First, we label each high and low with the points X, A, B, and C. The point D is the target.
The values between points are the ratio values.
In the example above, the ratio values are as follows.
XB 0.581, relative to AX (A=0, X=1), the height of AB is 0.581
AC 1.442, relative to BA (B=0, A=1), the height of BC is 1.442
BD 0.887, relative to CB (C=0, B=1), the height of CD is 0.887
XD 0.486, relative to AX (A=0, X=1), the height of AD is 0.486
If these ratios fall within a certain range, it is detected as a harmonic pattern.
Basically, we do not look at the time axis, so it is a comparison of heights rather than edge lengths.
I would like to look at a pattern more concretely.
As a representative, let’s examine the Bat pattern.
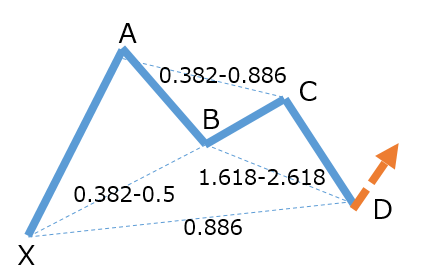
In the Bat pattern,
XB 0.382~0.5
AC 0.382~0.886
BD 1.618~2.618
The target is XD 0.886.
To write it a little more in detail, the following rules apply:
AX (A=0, X=1) relative height of AB is 0.382 ~ 0.5
BA (B=0, A=1) relative height of BC is 0.382 ~ 0.886
CB (C=0, B=1) relative height of CD is 1.618~2.618
When a waveform that satisfies these conditions is detected,
If the relative height of AD becomes 0.886 relative to AX (A=0, X=1), it is a timing for reversal.
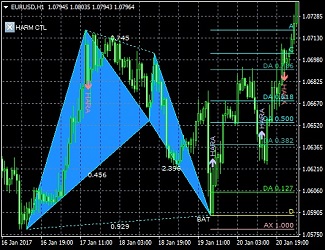
Now, I would like to see the actual chart.
This is the result of detecting the BAT pattern on EURUSD H1.
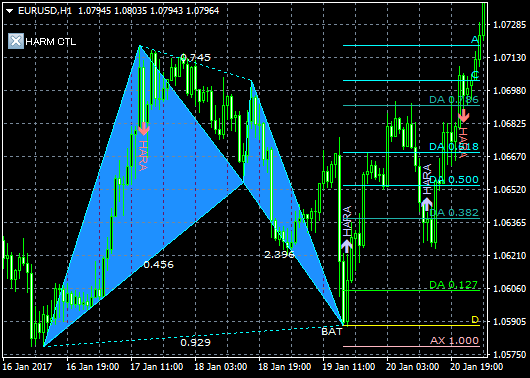
At this timing, the rebound is quite clean.
Let's display it in a wider range.
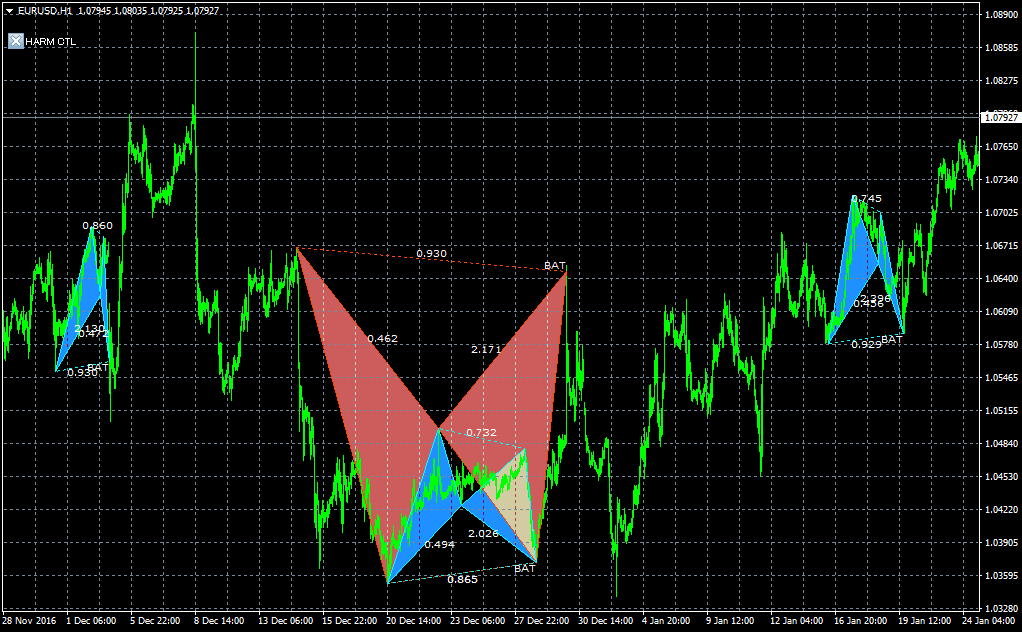
When viewed this way, the BAT pattern recently shows quite a high reliability.
Detecting many such patterns and trading at those timing is harmonic pattern trading.