

Future market outlook, strategies and opportunity currencies (from 9/11)
Hello, this is OnePiP Trade (@onepipst)
From 9/11 onward, I would like to forecast the market, formulate strategies, and look for entry points
Horizontal lines and trend lines are drawn based on daily charts
I also tweet about profits and other beneficial things,so please follow me on Twitter.
Table of contents
- Dollar/Yen (USD/JPY)
- Euro/Dollar (EUR/USD)
- Euro/Yen (EUR/JPY)
- Pound/Dollar (GBP/USD)
- Pound/Yen (GBP/JPY)
- Afterword
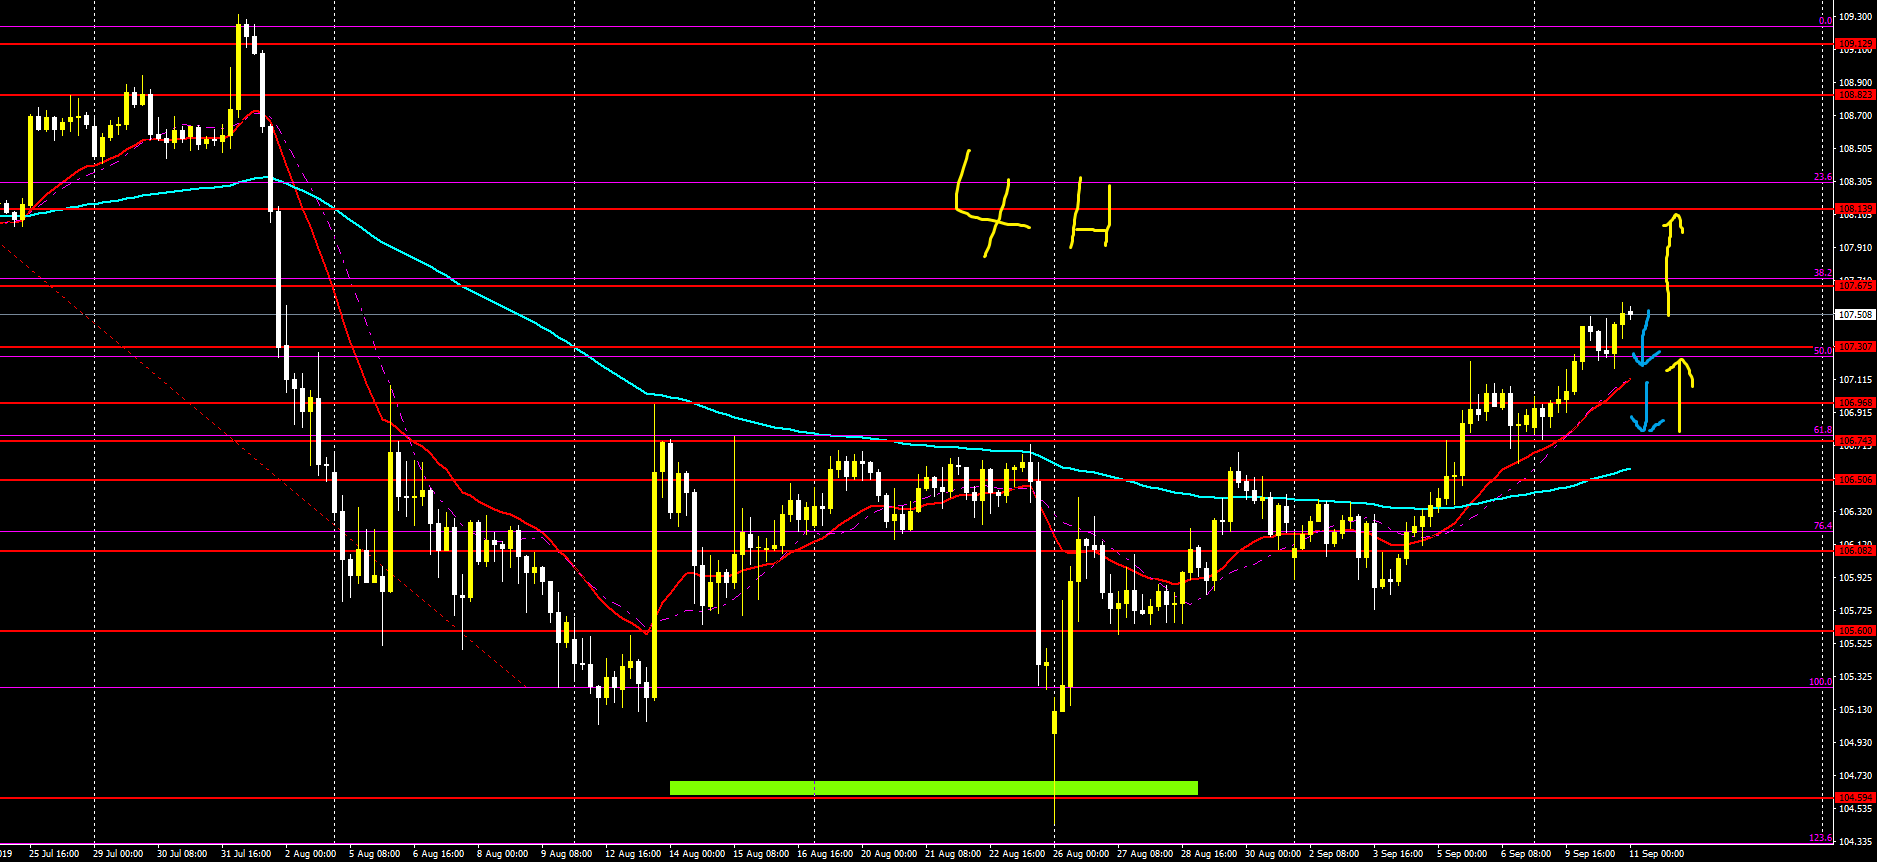
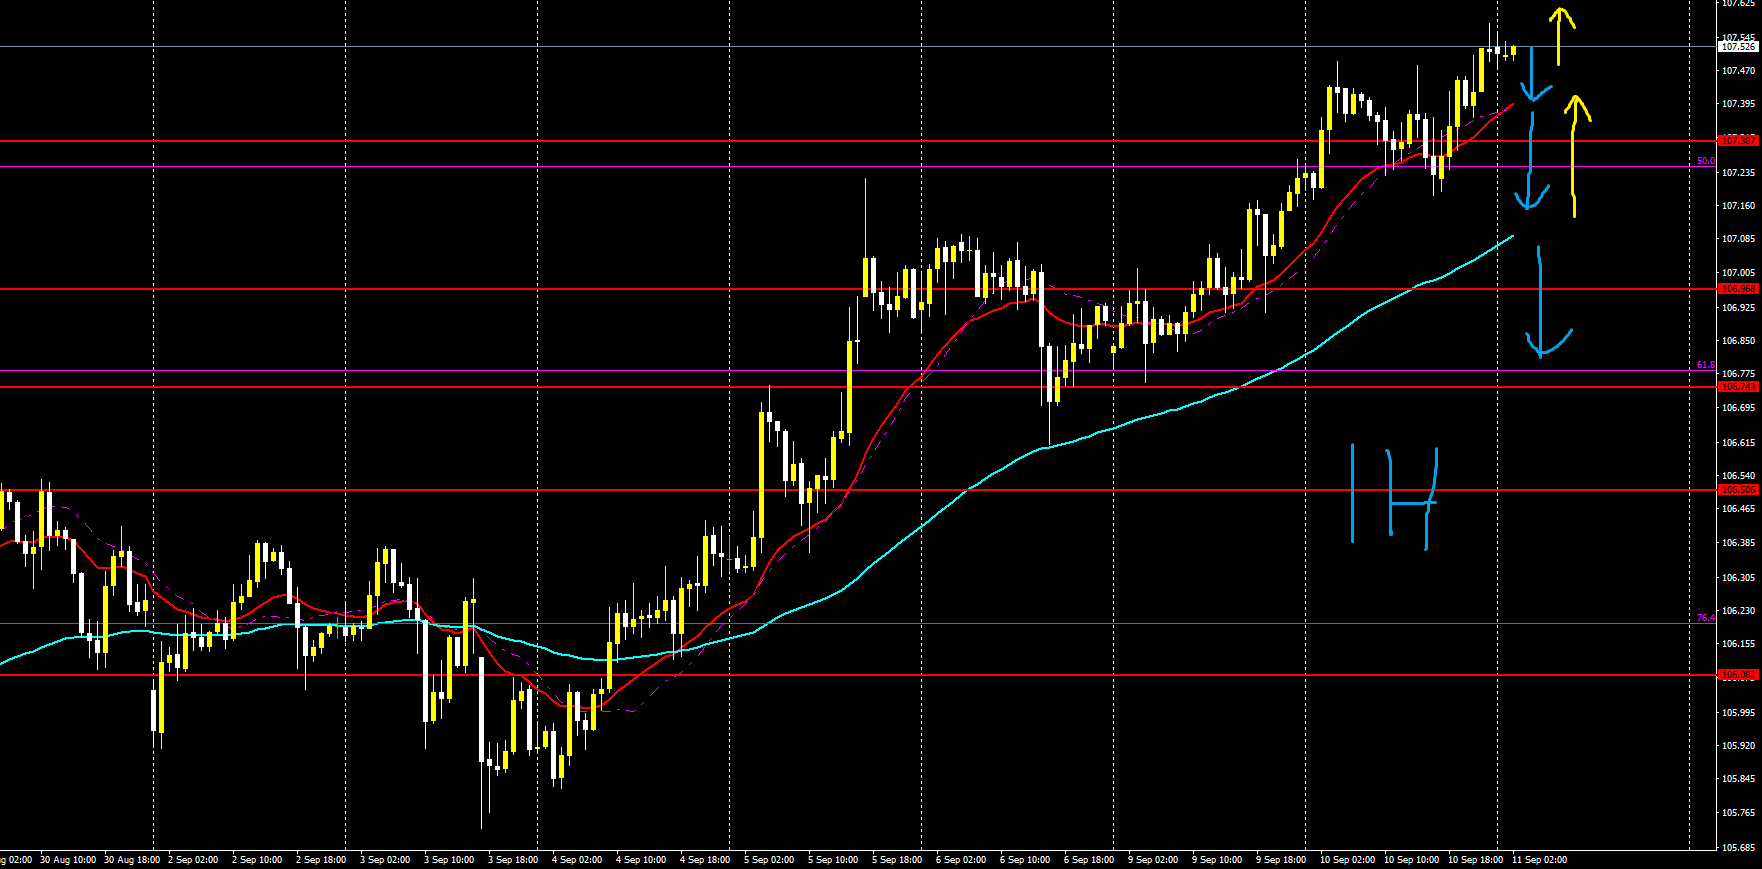
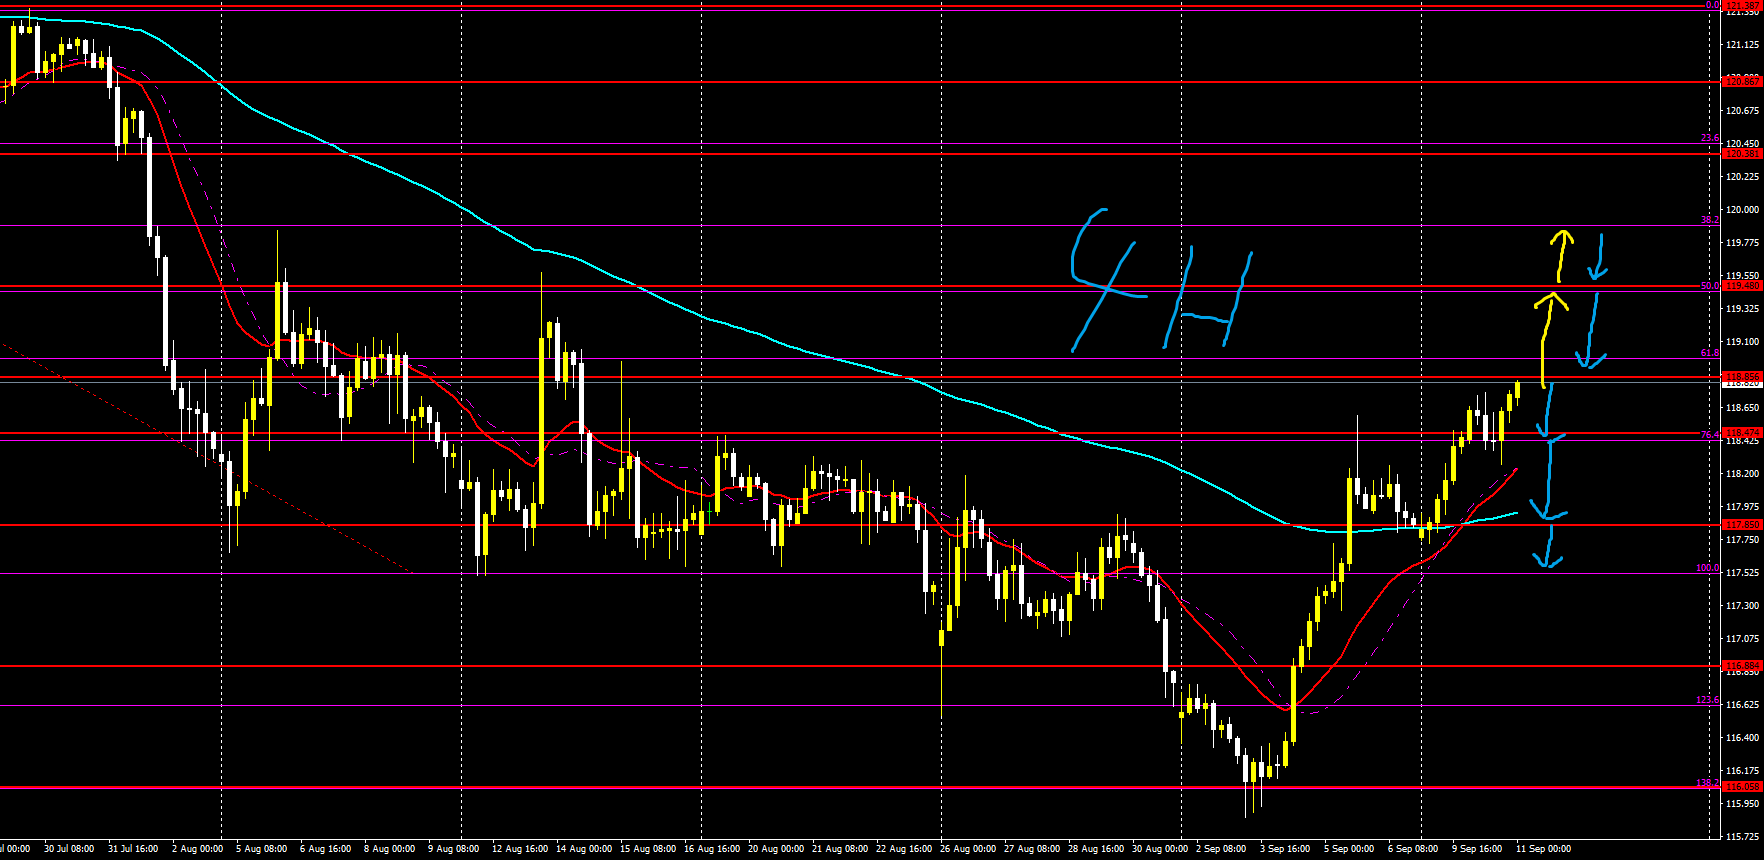
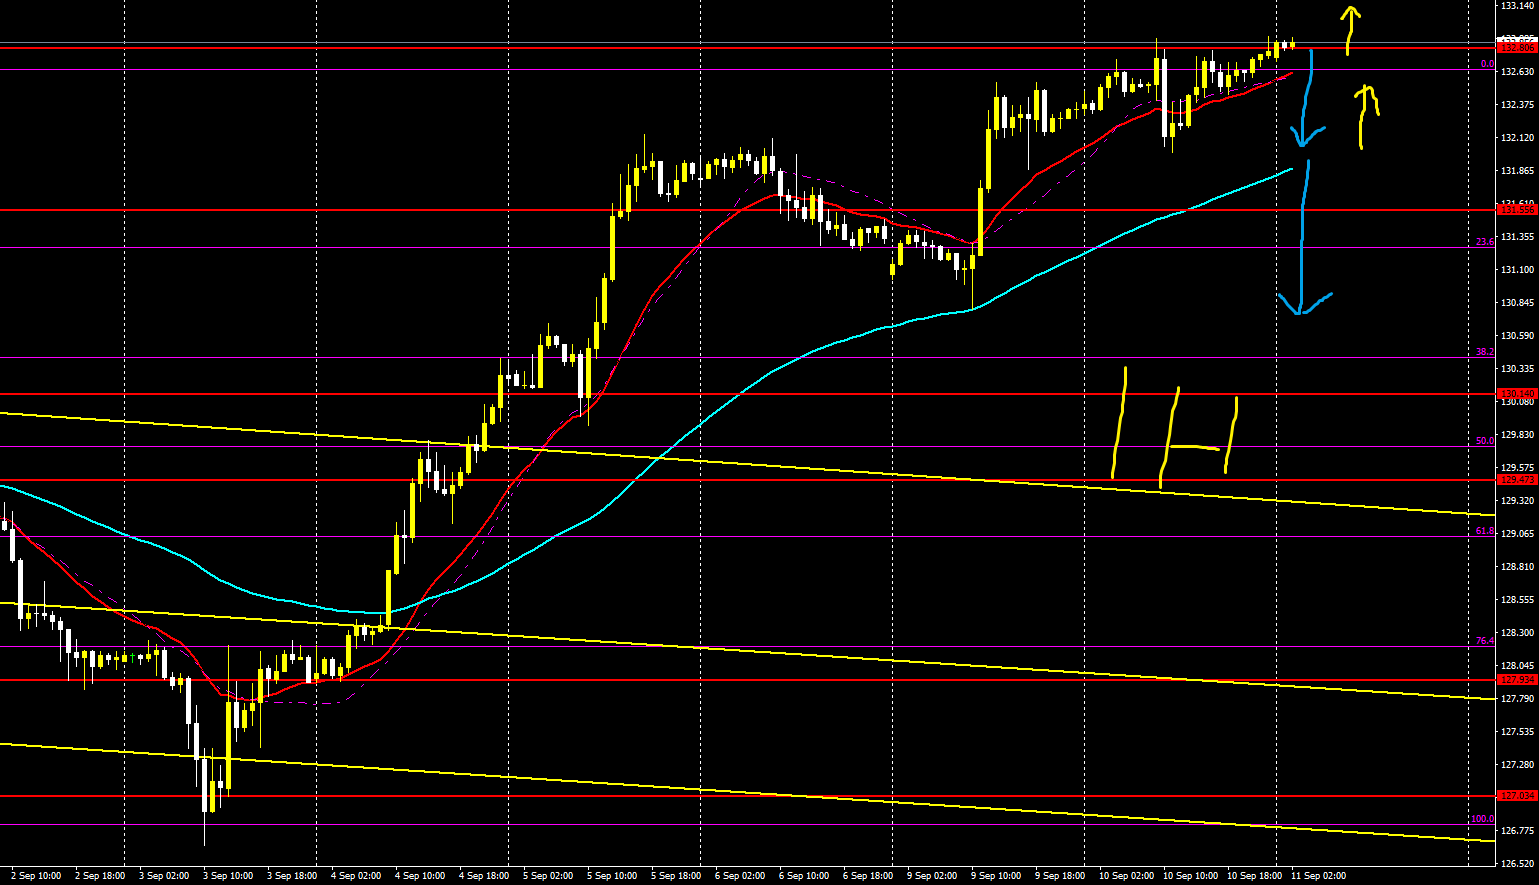
【USD/JPY】
Trading difficulty A-
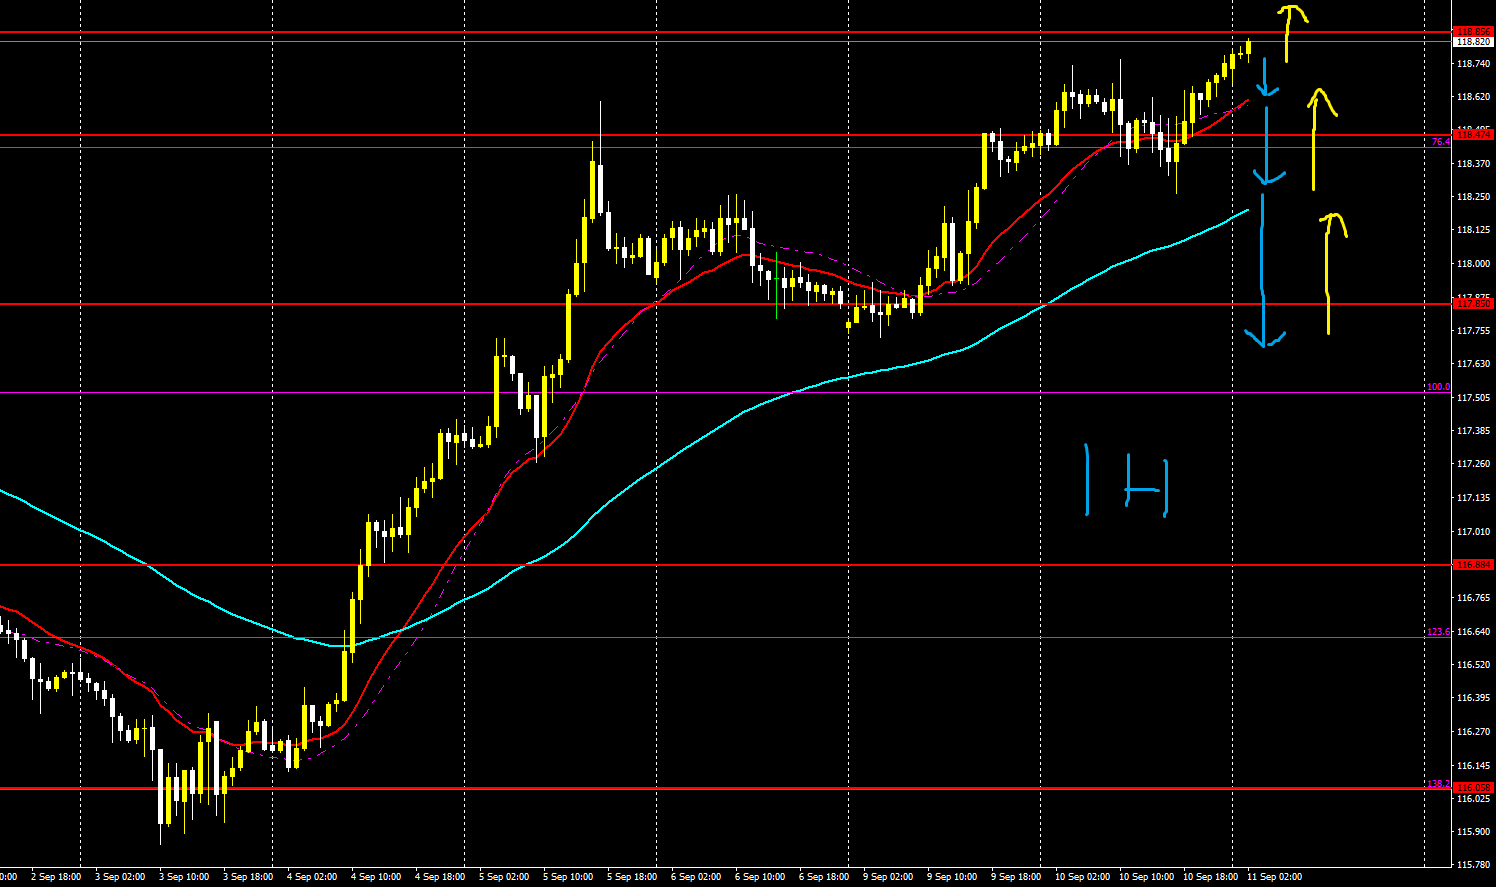
Long-term bias down, short-term up
Buying momentum is strong
There may be buying up to around the Fibonacci 23 level
So there will be occasional buying dips on the short-term chart
Conversely, we should sell on pullbacks
4 hours
1 hour
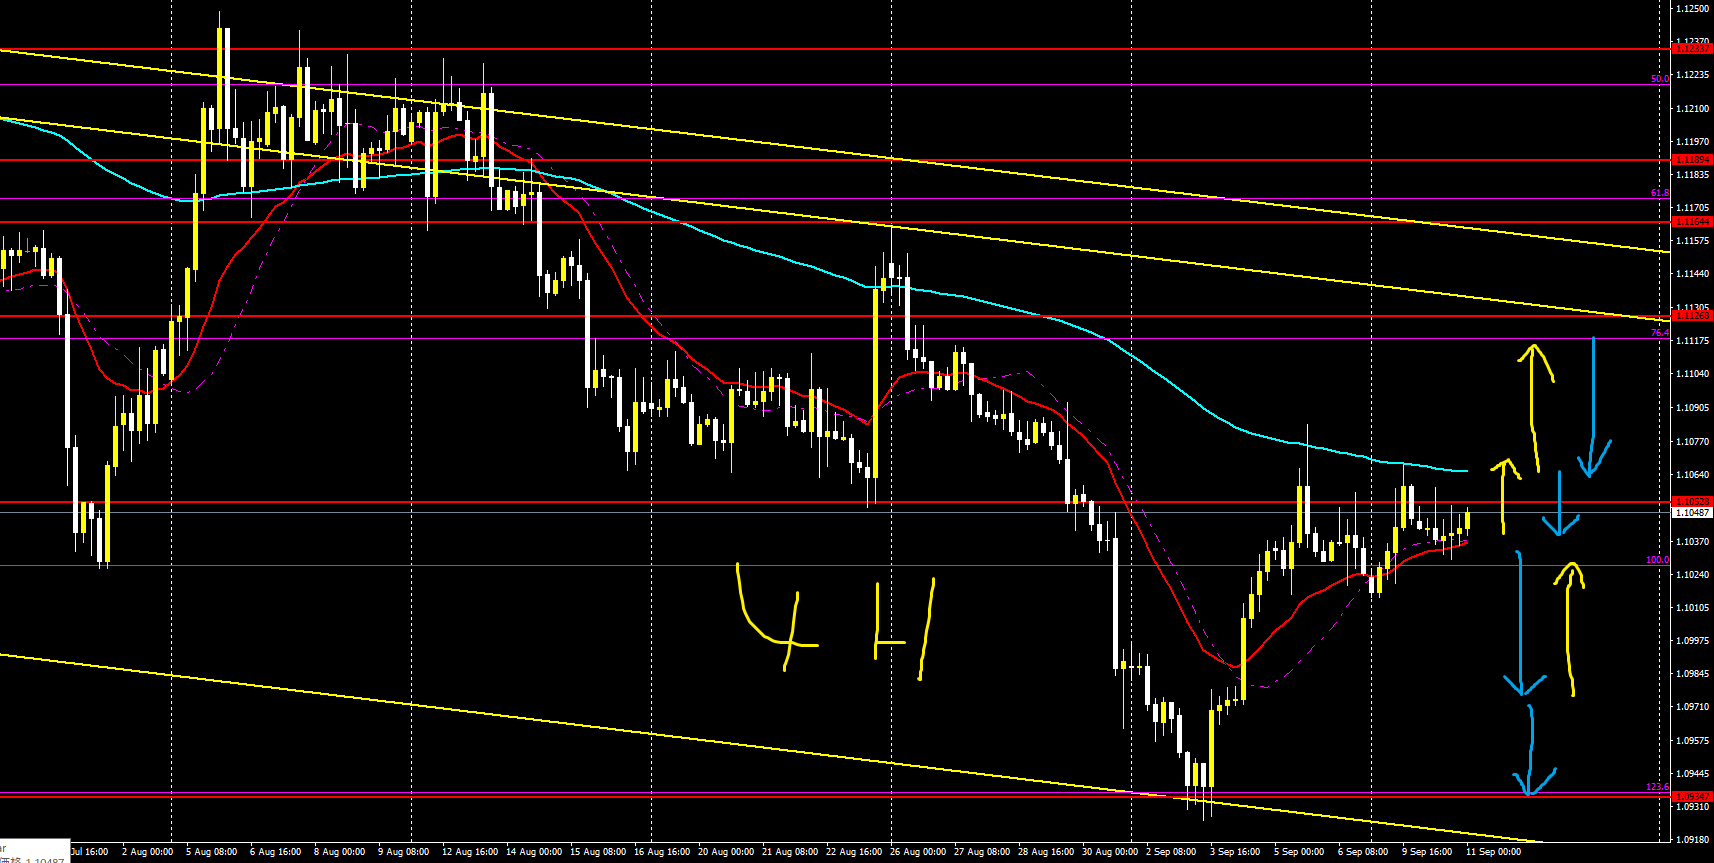
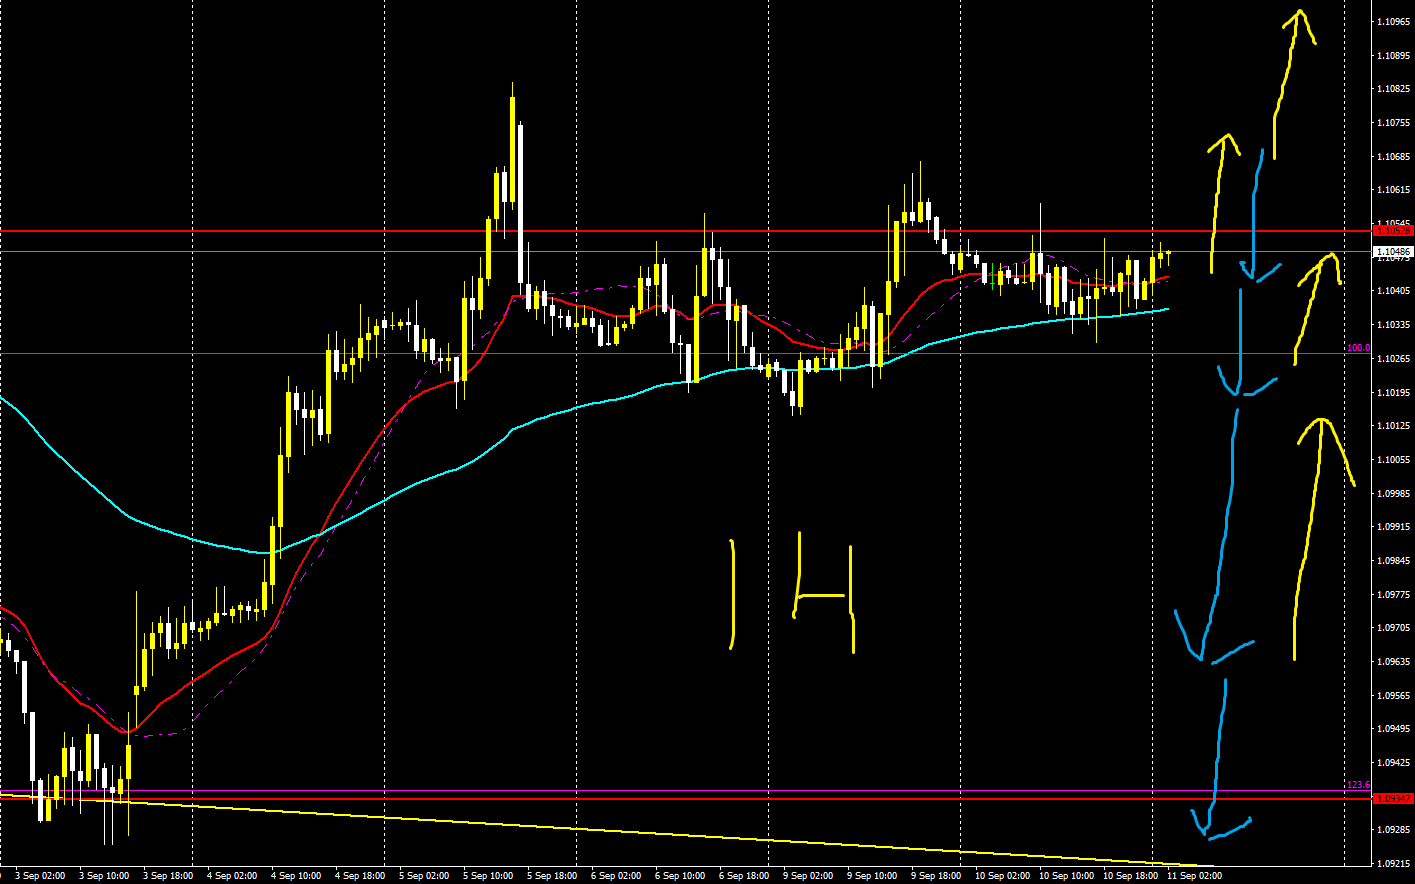
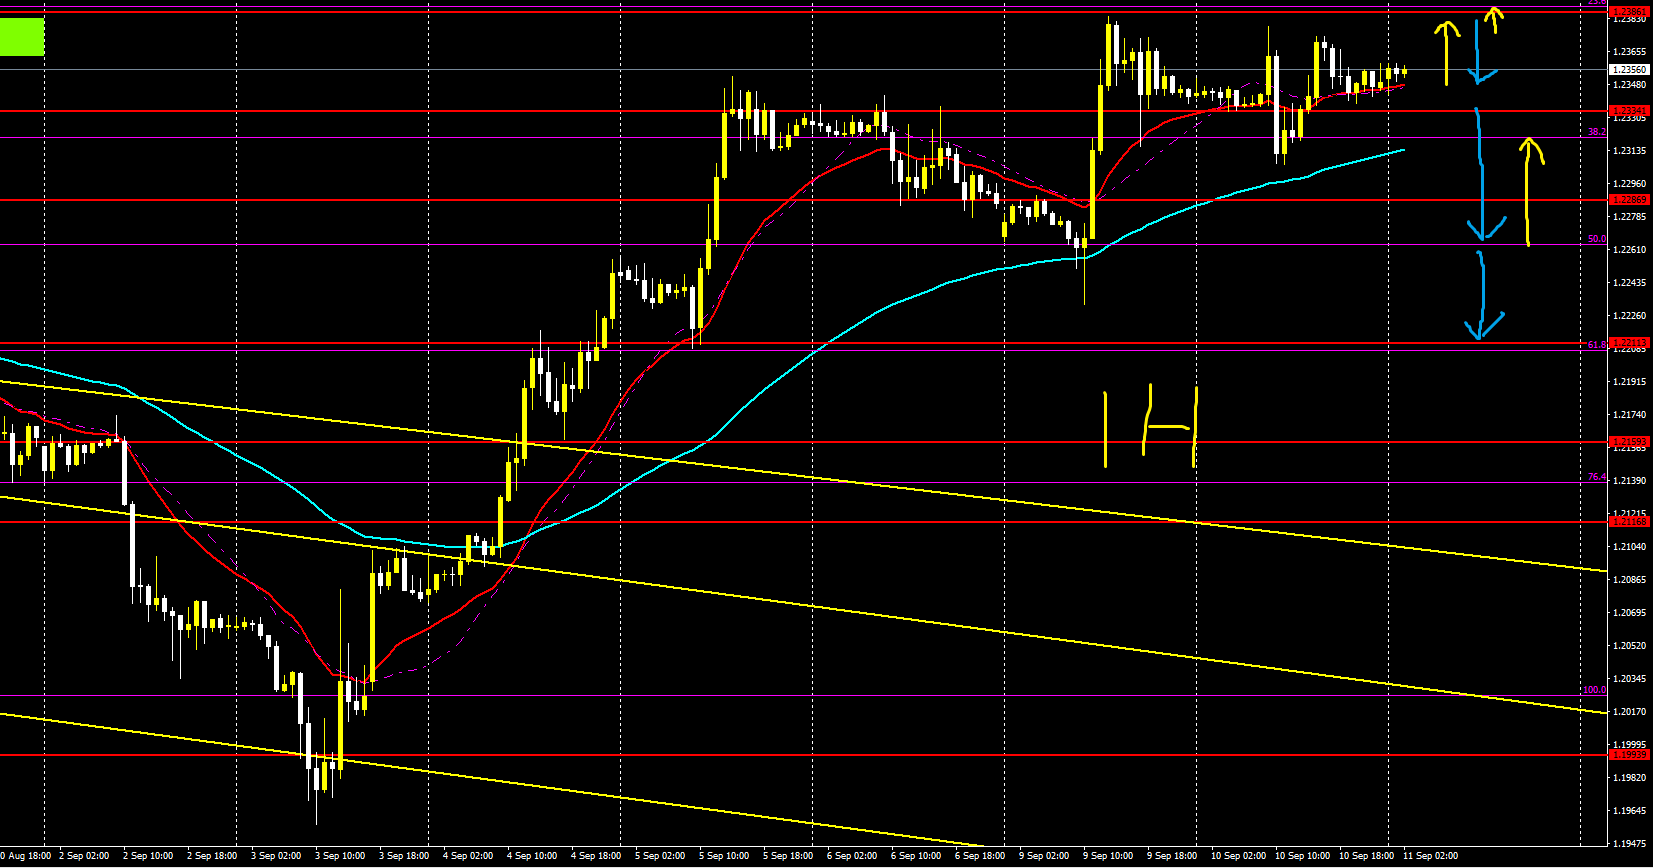
【EUR/USD】
Trading difficulty B-
Long-term bias down, short-term up
Short-term range is forming
Can trade the range, and follow the breakout
Upward toward the channel upper bound
Downward toward the neck line at the channel lower bound
4 hours
1 hour
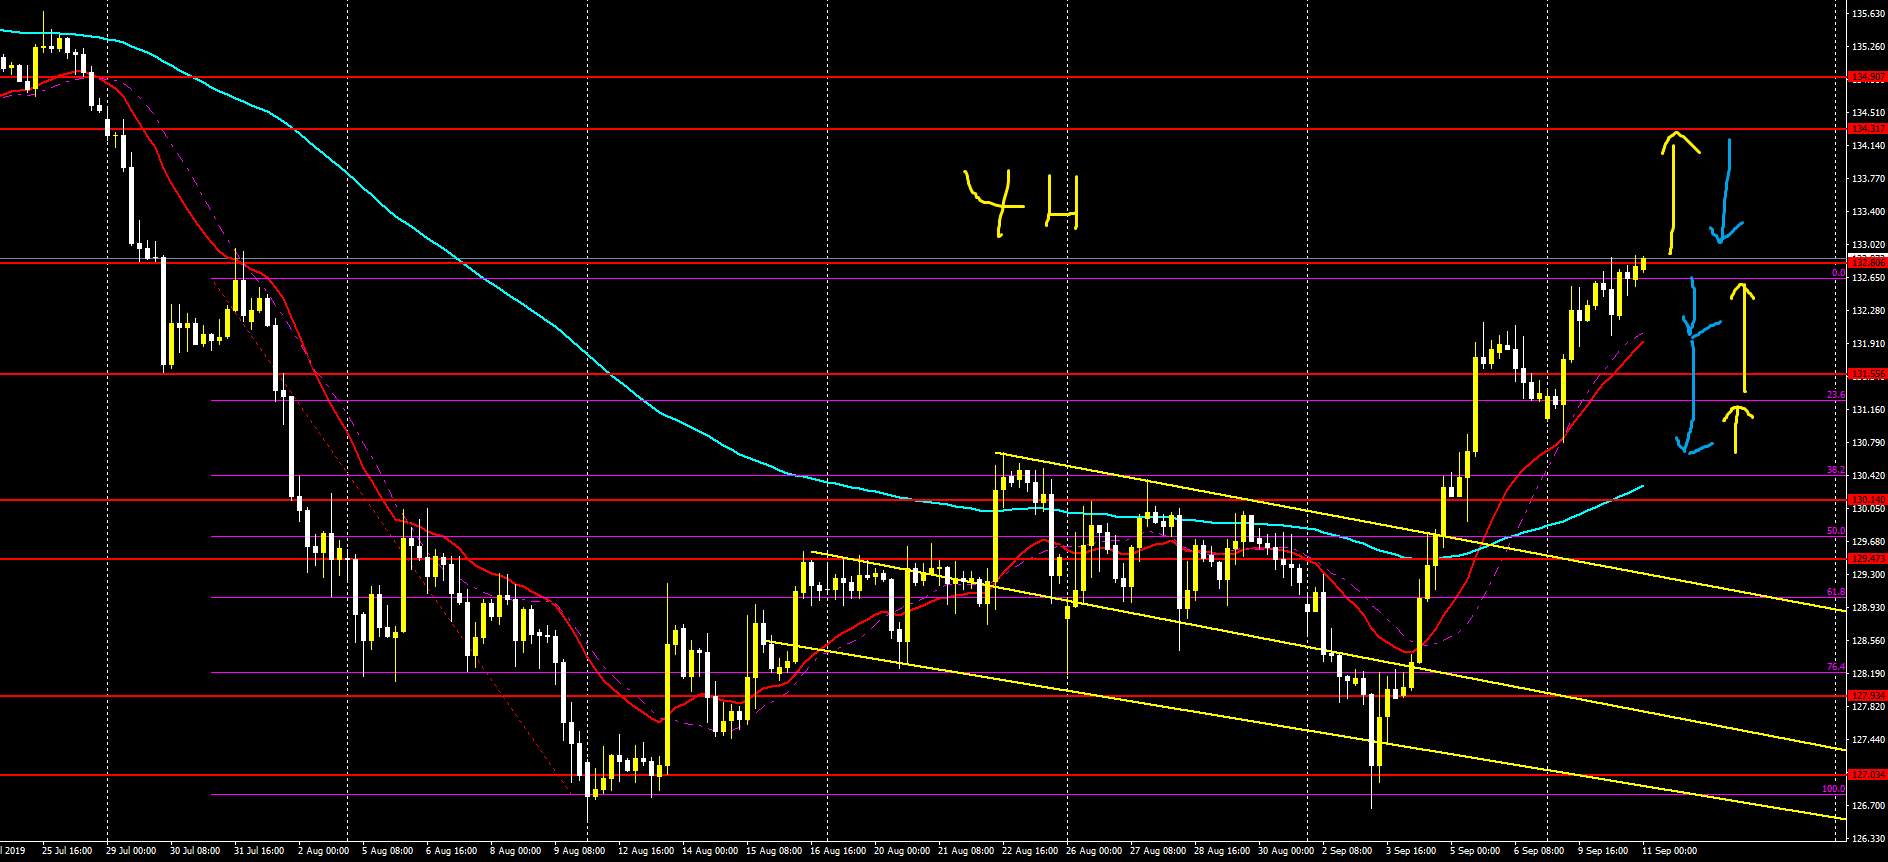
Euro/Yen (EUR/JPY)
Trading difficulty A-
Long-term bias down, short-term up
Buying pressure seems strong
Aim for Fibonacci 50
Look for short-term pullback buying opportunities
Alternatively, selling on pullbacks is also fine
4 hours
1 hour
【GBP/USD】
Trading difficulty A-
Long-term up, short-term up as well
On the daily chart there is a slight uptrend, but there is immediate support above, so further selling pressure is likely
Fibonacci 23 serves as a support line
Whether it breaks through Fibonacci 23
Short-term counter-trend selling might be good
But if buying resumes, proceed with buying
4 hours

1 hour
【GBP/JPY】
Trading difficulty A-
Long-term up, short-term up
There is slightly more room to buy than GBP/USD
So I would like to look for pullback buying on short-term charts
But be cautious of potential pullbacks
4 hours
1 hour
【Afterword】
The arrows drawn in the images indicate the favorable direction
Yellow indicates upward direction
Light blue indicates downward direction
Trading difficulty
The easier the direction, the higher the likelihood
But it only indicates relative advantage; it does not guarantee reaction or rebound at that level
However, near these levels I have drawn arrows, so please use them as trading references
The arrows may become profit-taking or stop-loss points
And likewise, lines and Fibonacci should be used as references for profit-taking, stop-loss, or entry points
Market forecasts and strategies delivered on YouTube every week have generally been accurate
What matters is how you apply them to trading and entries
When the market strategy was right or wrong, trading methods and approaches differ
And please treat entries as a separate matter