

Future market outlook, strategies and opportunity currencies (from 7/10)
Hello, this is OnePiece Trader (@onepipst)
From 7/10 onwards, I will forecast the market, set strategies, and look for entry points
I also tweet about profits and other useful things,so pleasefollow us on Twitter.
Table of contents
- USD/JPY (Dollar/Yen)
- EUR/USD (Euro/Dollar)
- EUR/JPY (Euro/Yen)
- GBP/USD (Pound/Dollar)
- GBP/JPY (Pound/Yen)
- Afterword
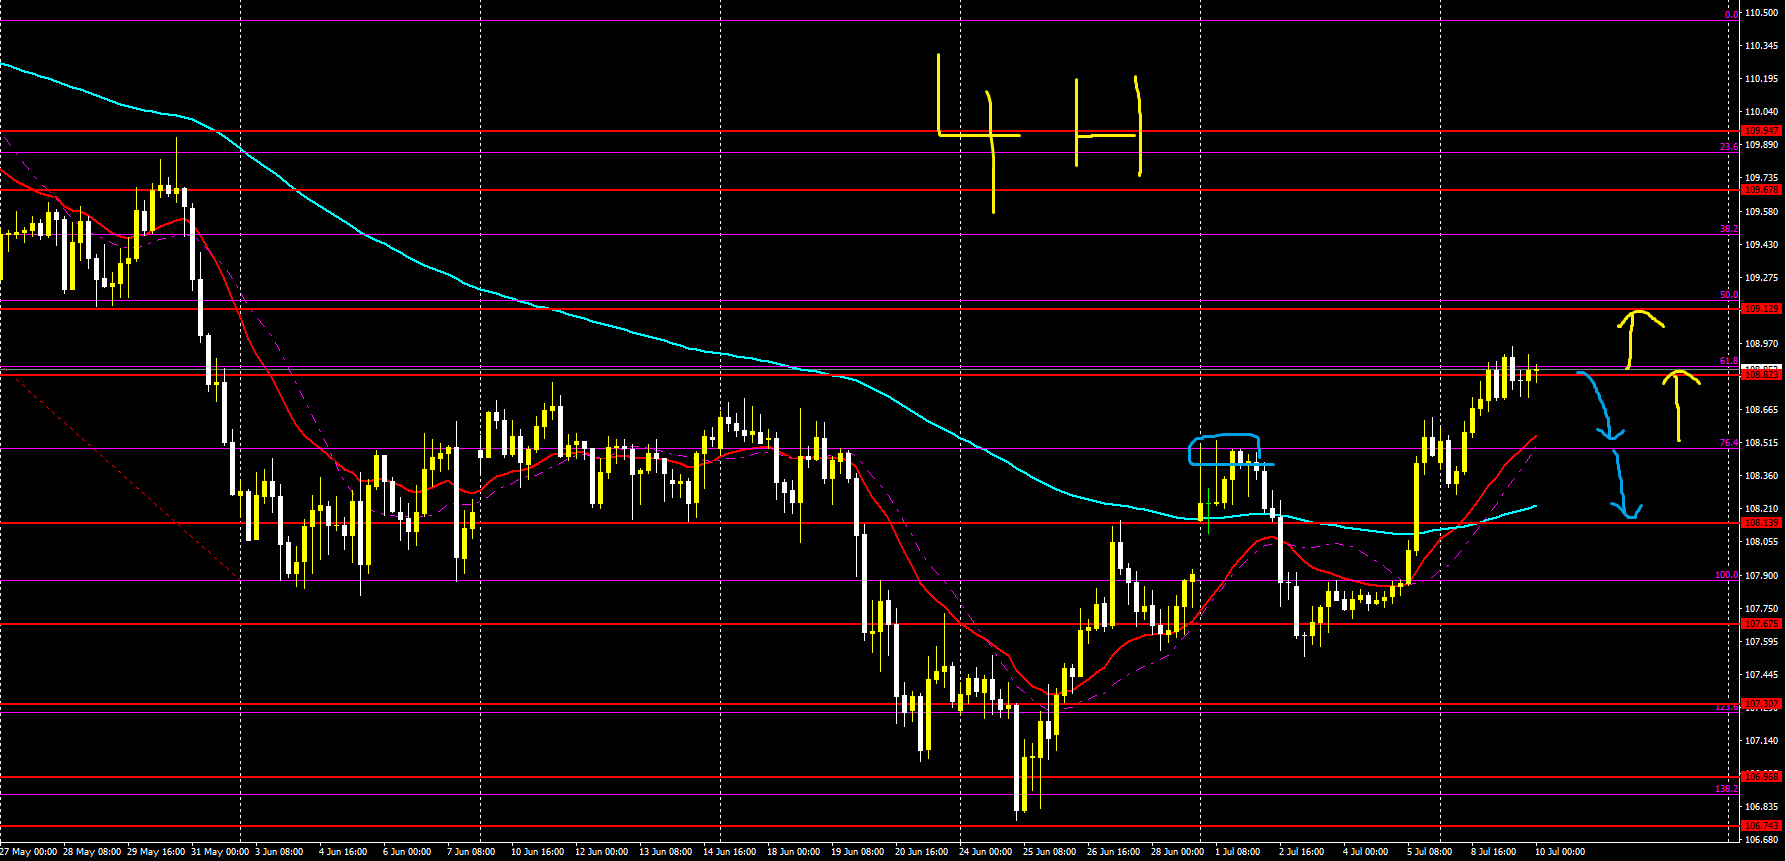
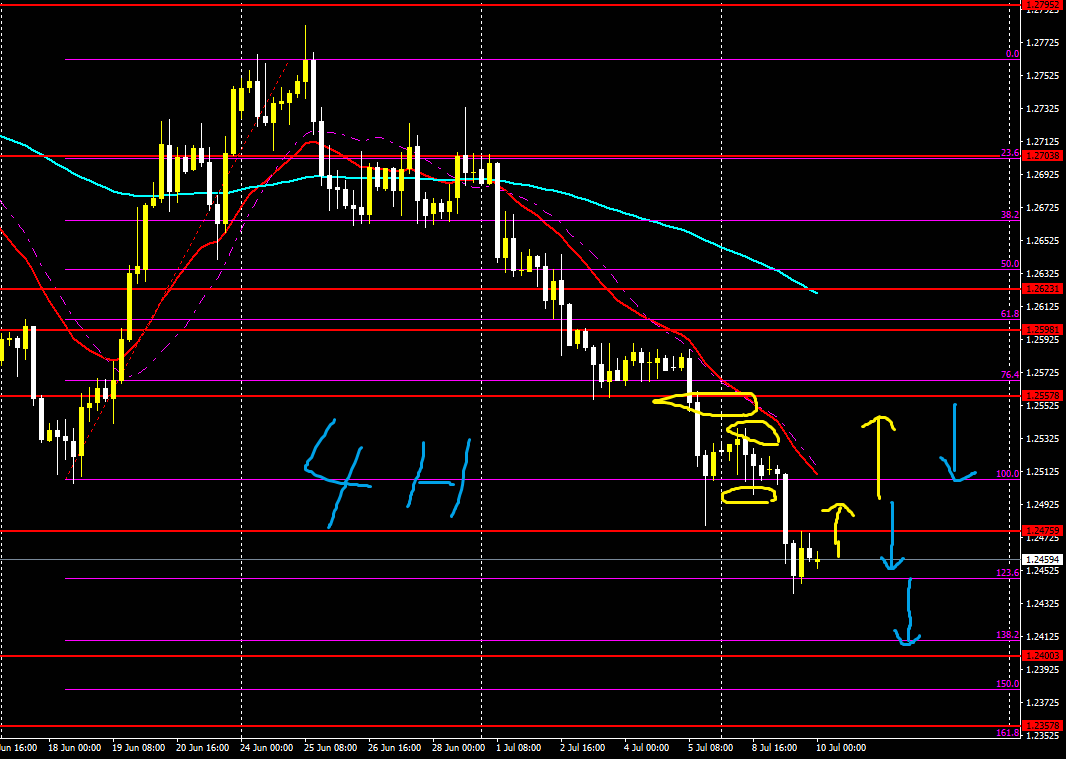
【USD/JPY】
Trading difficulty B+
Long-term outlook is down, short-term is up
Currently rebounding around the 61 Fibonacci level, there is a possibility of selling pressure
Since it’s a move to push back, attack with a sell here
Watch the 76 Fibonacci or lower lines and the Grandville MA
If it pushes back, ride the downtrend
It’s also possible to rise without a pushback
Target is Fibonacci 50
4-hour
1-hour

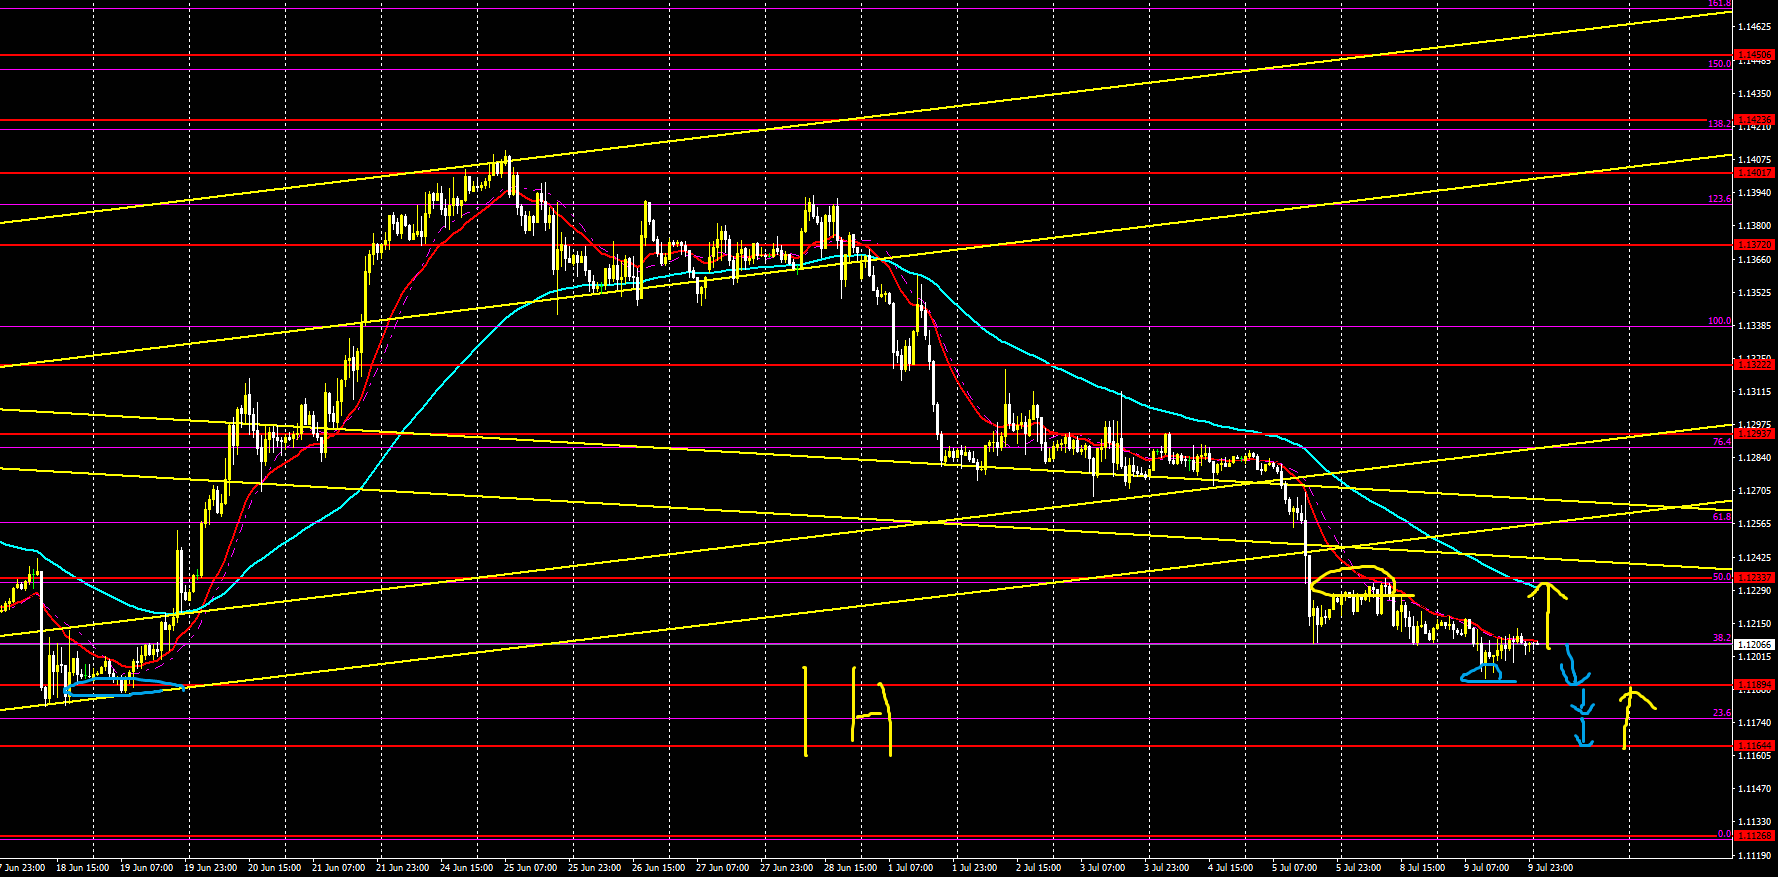
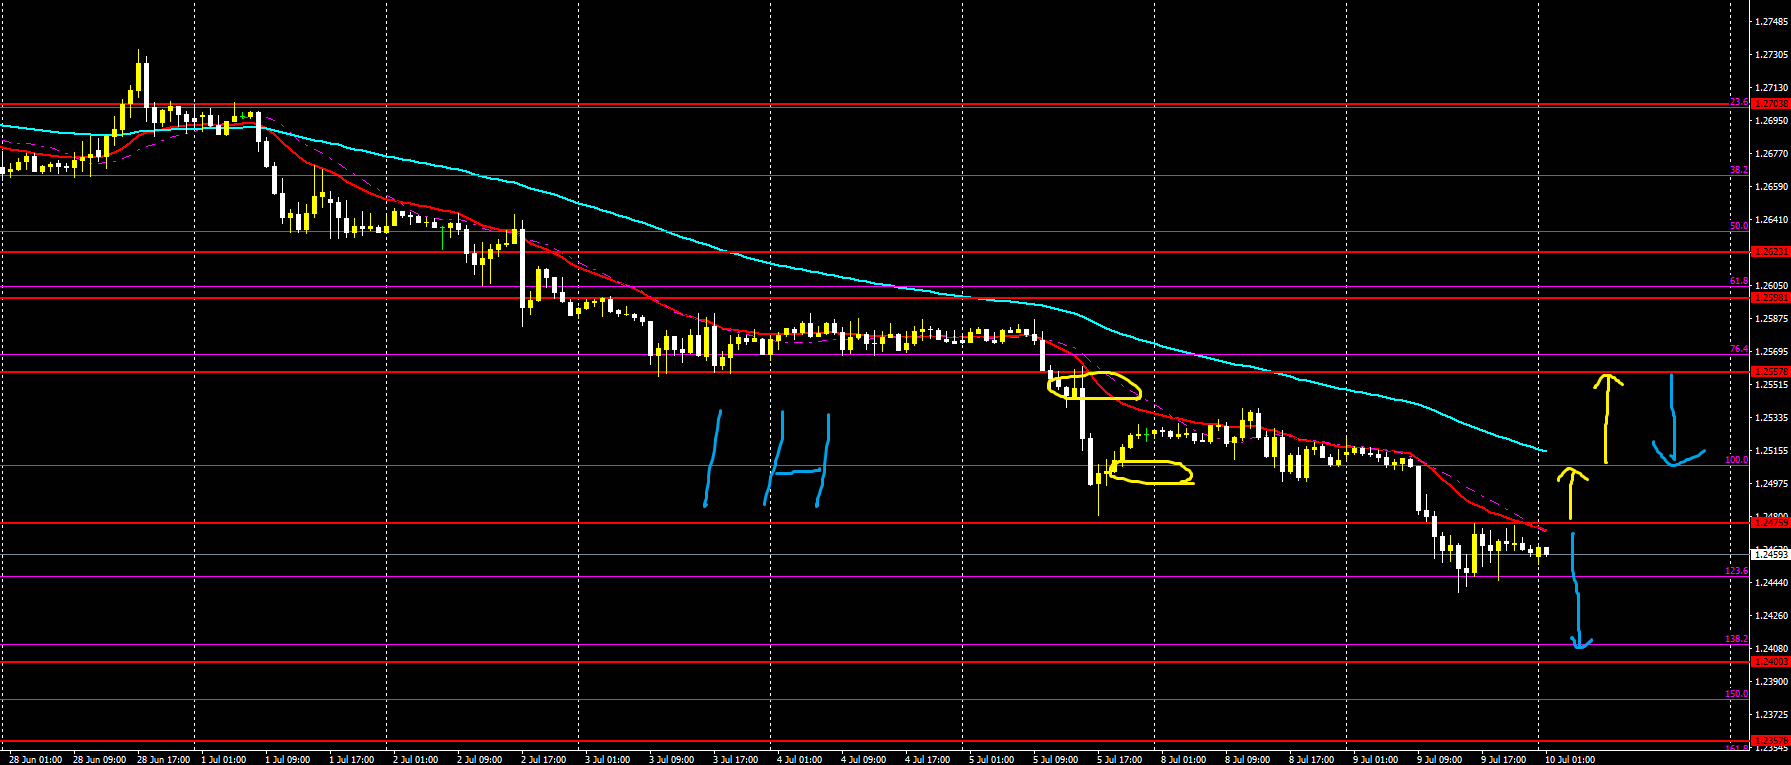
【EUR/USD】
Trading difficulty A-
Long-term outlook is up, short-term is down
A rebound-selling market
If selling, sell along Fibonacci levels, lines, or MA
A little above Fibonacci 0 is safer
When a pullback comes, expect Fibonacci 50 or 61
If positioned above the MA, it might be okay to take profits
4-hour

1-hour
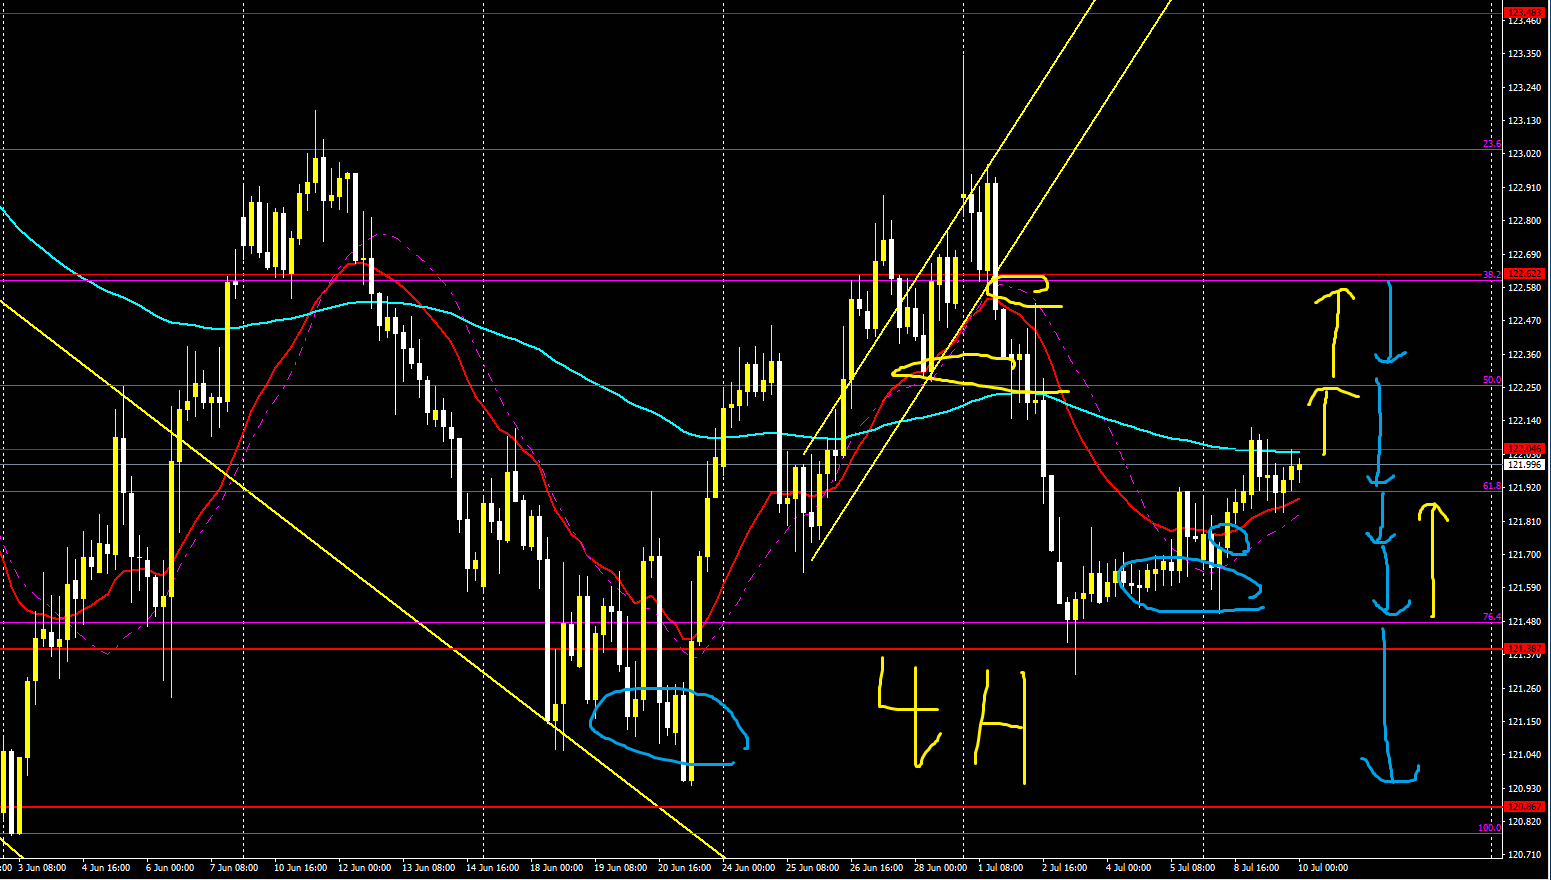
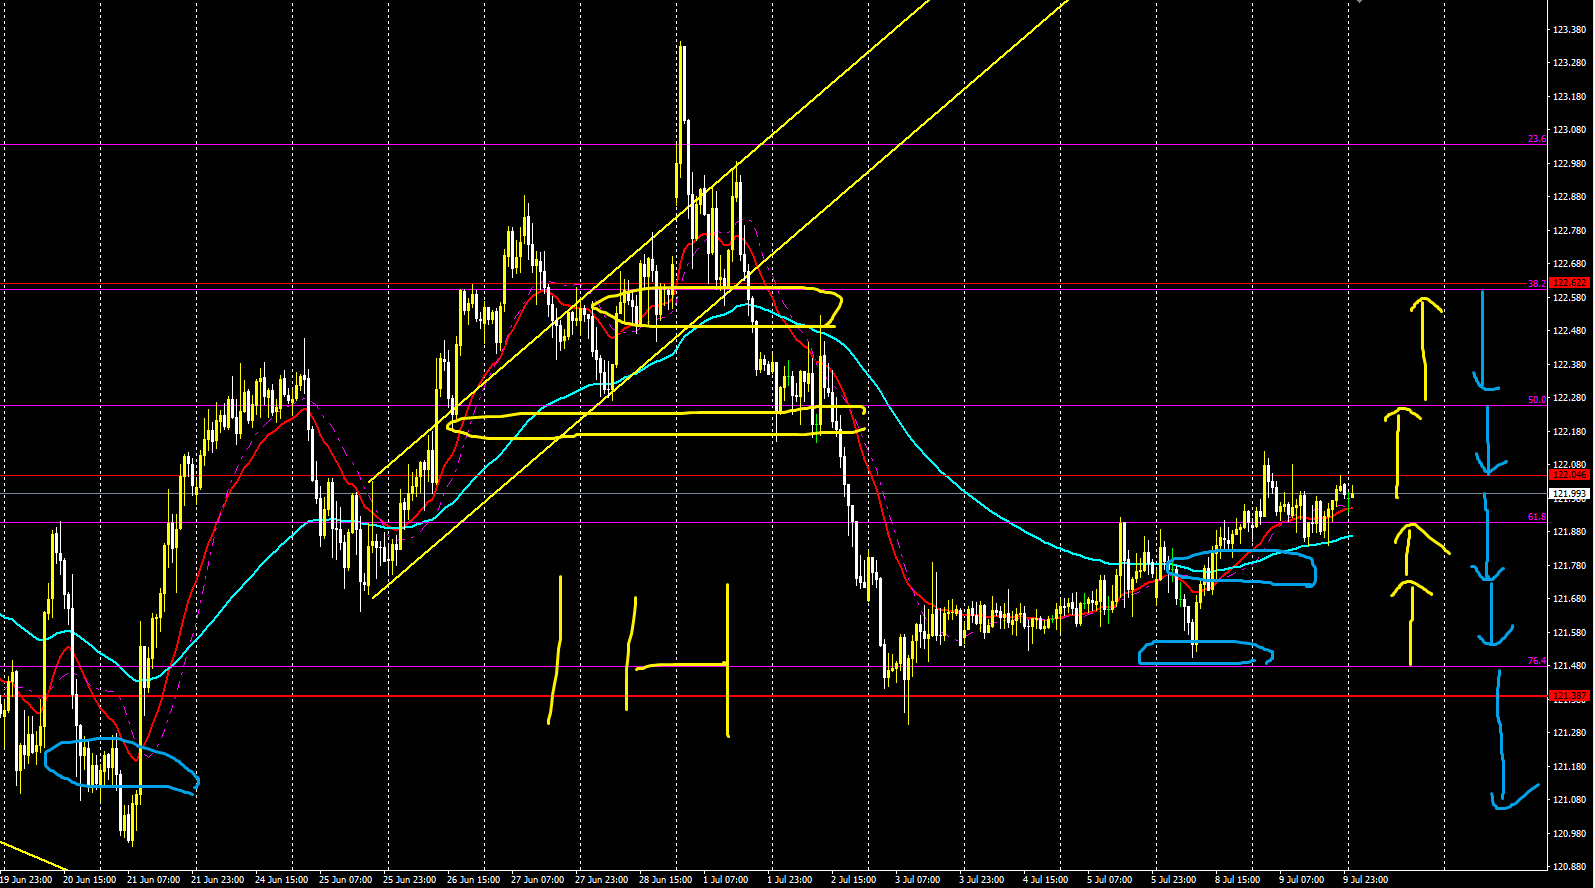
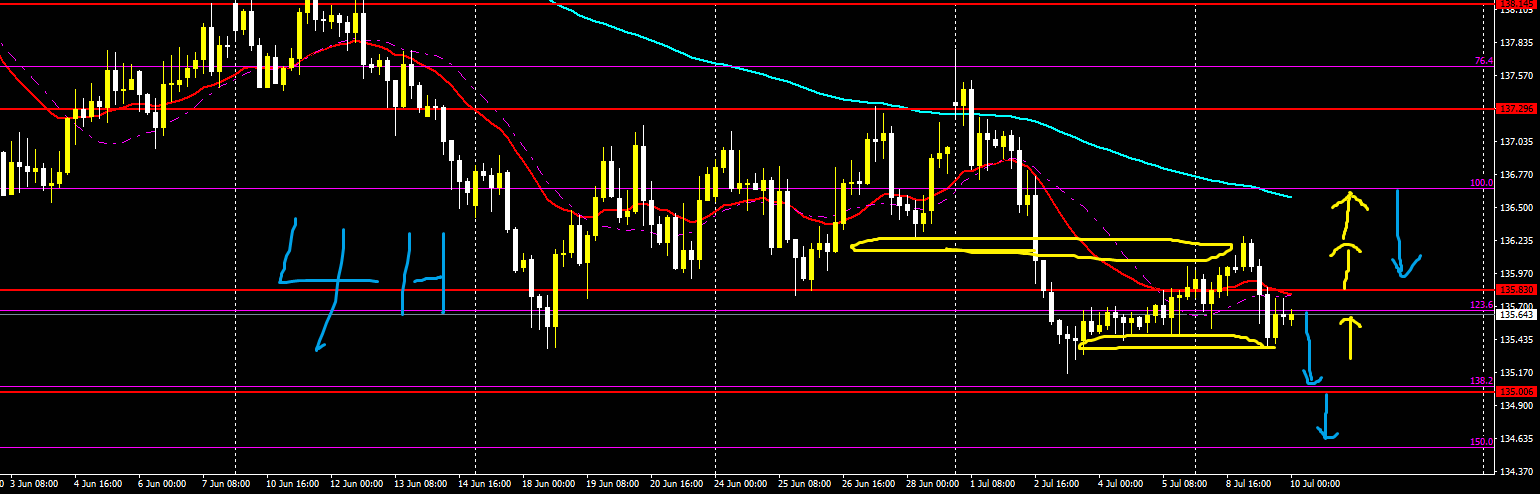
EUR/JPY】
Trading difficulty B+
Long-term outlook is down, short-term also down
Strategy: buy up to Fibonacci 50 and sell up to Fibonacci 76
If it continues to rise, buying up to Fibonacci 50 could be good
There may be selling pressure from there
If there is no buying and you go straight to selling, target half of Fibonacci 76 or up to 76
4-hour
1-hour
【GBP/USD】
Trading difficulty A-
Long-term outlook is down, short-term also down
Currently near a strong support area, so buying pressure may come
Rates near the January flash crash
However, it has become a return-to-sell market
Rely on MA, Fibonacci, and lines to execute break-sell or pullback-sell
If it rises above Fibonacci 100 and sits above the MA, there may be buying up to Fibonacci 76 or 61
4-hour
1-hour
【GBP/JPY】
Trading difficulty B-
Long-term outlook is down, short-term also down
We’d like to sell, but buying pressure may come, so be cautious
In selling cases, target around Fibonacci 138 or 150
Buying targets are recent highs or up to Fibonacci 100
Refer to the arrows for both
4-hour
1-hour
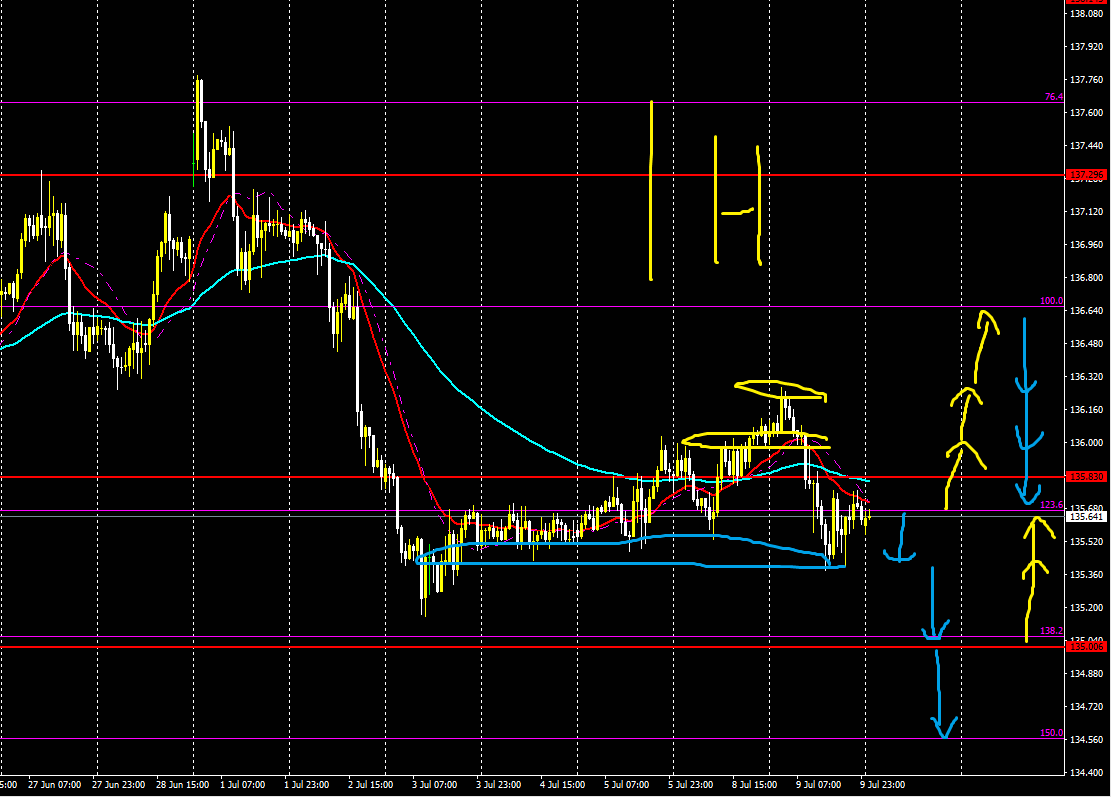
【GBP/JPY】
Trading difficulty B-The arrows drawn in the image indicate the favorable direction
Yellow indicates upward direction
Light blue indicates downward direction
Long-term outlook is down, short-term also downThis only indicates relative superiority of that direction, it does not guarantee that the rate will respond or rebound at that level
However, arrows are drawn around key levels, so please use them as reference for trading
Arrows may become take-profit or stop-loss points
We would like to sell, but buying pressure may come, so be cautiousAnd please use lines and Fibonacci similarly as take-profit, stop-loss, and entry point references
Selling targets: around Fibonacci 138 or 150Weekly market forecasts and strategies are posted on YouTube, and they are usually quite accurate
What matters is how you apply them to trading and entries
When market strategy was accurate or not, your trading approach and mindset can change
Buying targets: recent highs or up to Fibonacci 100And please treat entries as a separate matter


