

Learn how to create a trading plan from a currency broker|Episode 17: Incorporating the concept of the three-wave patterns into USD/JPY market analysis (10) [Toshirō Asano]
Toshirō Asano will fully teach the trading methods and market-structure know-how grounded in his own experience and knowledge in this project. As in the last issue, we will continue to read the recent and future USD/JPY market, and then present the optimal buying and selling plan based on that analysis.
*This article is a reprint and revised edition of FXStrategy.com’s September 2018 issue. Please note that the market information written in the text may differ from the current market.
Toshirō Asano Profile

Asano, Toshirō. He has worked at Tokyo Forex, a foreign exchange trading intermediary of the Tokyu Group, and at EBS (now ICAP), which boasted over 80% of the world market share for currency trading, among others. He has firsthand experience of historical markets such as the 1985 Plaza Accord, the era of strong yen thereafter, the bubble burst, and the 2000 euro introduction, fostering his market sense. Later, he founded two FX trading companies and also worked as a dealer for private FX funds. Currently, he writes for the daily blog of Investment School Group. He is also highly regarded for his easy-to-understand video works utilizing his specialty in video editing.
Add Latest High N and Its Pullback O
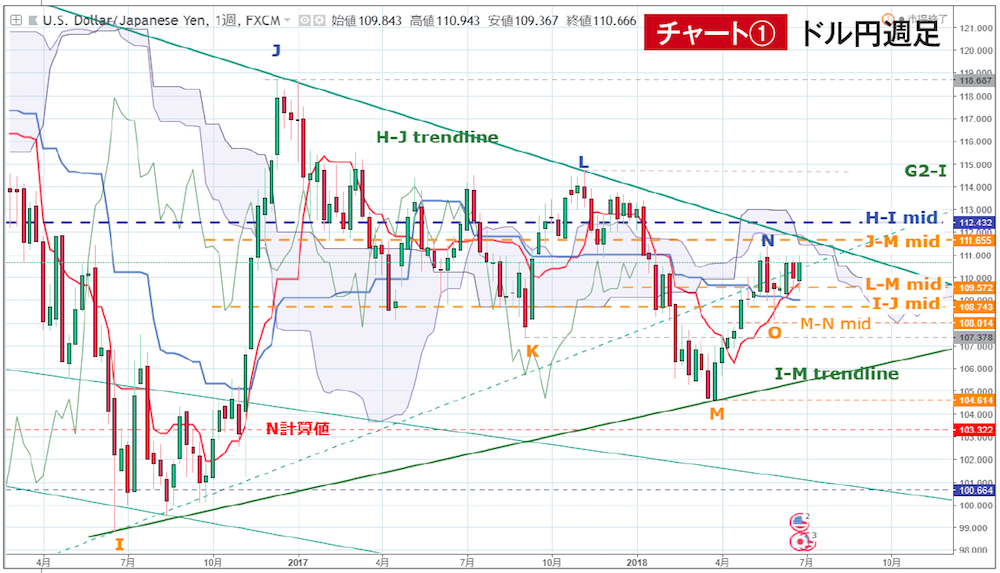
Chart ① Source:USD/JPY chart by TradingView
First, I will briefly touch on the market development from the previous issue. As you can see in Weekly Chart ①, the conversion line has risen passively up to now, with the highs and lows to be targeted determined as N and O; unless one of them is surpassed, it will continue to hover around 109.75 for some time. The standard line, which has been declining passively, has achieved the favorable cross with the conversion line as expected.
Now, for the chart changes at this issue, I have provisionally displayed the most recent high N (111.39) and its pullback low O (108.11) which are necessary to describe the market, and added M–N mid, which will serve as the near-term downside target. If the market continues to move between M and N for a while, the upper limit of the L–M wave that the standard line targets will be off by two more lines, so you should already master the passive descent to the position of M–N mid.


