

Technical-focused strategies for thriving in the market: Episode 5 - Cutting loss points during trends [Hiroyuki Taimukai]
In this series, professional trader Hiroyuki Tamukai will lecturing on trading techniques focused on technical analysis over several installments. The theme for this issue is where to place stop-loss points in trending markets. Let’s learn how to identify appropriate stop-loss points.
*This article is a reproduction and revision of an article from FX攻略.com September 2018 issue. Please note that the market information stated in the text may differ from the current market.
Profile of Hiroyuki Tamukai
Tamukai Hiroyuki. After graduating from university, he attempted qualification exams but failed. Unable to find employment, he started a business by necessity. He began investing during the course of running the business. Now, after transferring the business, he is a personal investor. He also plans and organizes seminars for FX companies. His books include “FX Introduction That Even a Timid Person Can Win” (Ikeda Shoten) and “Steadily Win with 2 Chart Checks a Day for Part-Time FX” (Jiyu Kokuminsha).
Range and Trend
Last time we introduced how to find and use stop-loss points in a range market. By learning technical analysis and reading charts, it becomes easier to locate appropriate stop-loss levels, from which you can build your trading strategy. In the previous issue we focused on sideways markets before a trend begins, but when the range breaks, a trend begins. This time we consider appropriate stop-loss points in trending markets.
When you start FX, you learn that markets have ranges and trends. You will often hear that you “go counter-trend within a range and follow the trend in a trend,” or that “trend markets make profits wider and easier for anyone to earn.” I myself think this way and write it as well. However, what you must be careful about is not to think that ranges and trends are completely separate. Within a wide-range on a longer time frame there are trends on a smaller time frame. And within a trending market there are ranges. Ranges and trends are closely connected.
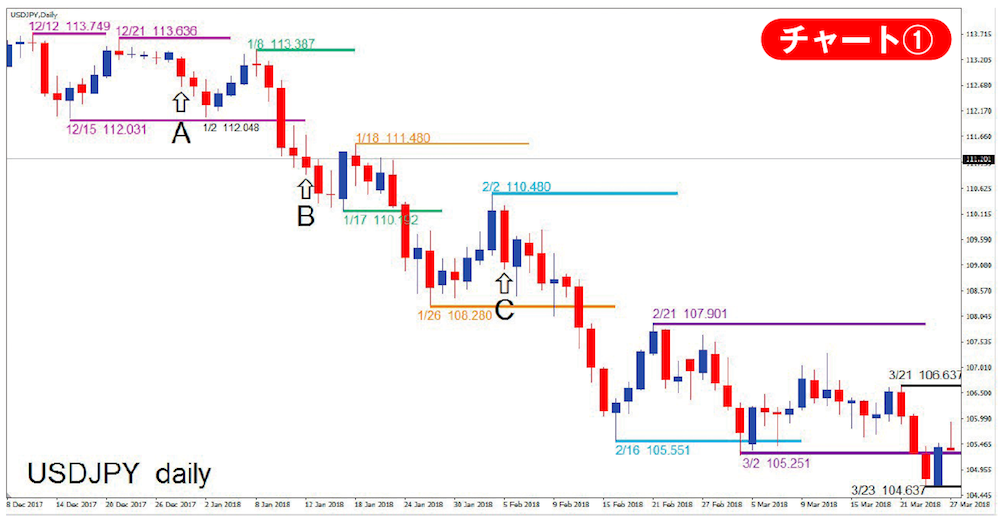
Chart ① is a continuation from last month's issue, and you can see in this downtrend that there is a range highlighted by color attention to highs and lows. A trend does not become a trend overnight; it results from a range market continuing to break in a certain direction.
As I wrote in the second installment of this series, markets first have price movements, and technical indicators are the calculations derived from those movements. Therefore, if the market starts moving in a definite direction and repeatedly breaks the range to form a trend, technical indicators will naturally indicate a trend as well.


